. 2012 Dec 1:393:12-23.
doi: 10.1016/j.ica.2012.06.026. Epub 2012 Jun 25.

Imaging free zinc levels in vivo - what can be learned?

Affiliations

Imaging free zinc levels in vivo - what can be learned?

Luis De Leon-Rodriguez et al. Inorganica Chim Acta. .

Abstract

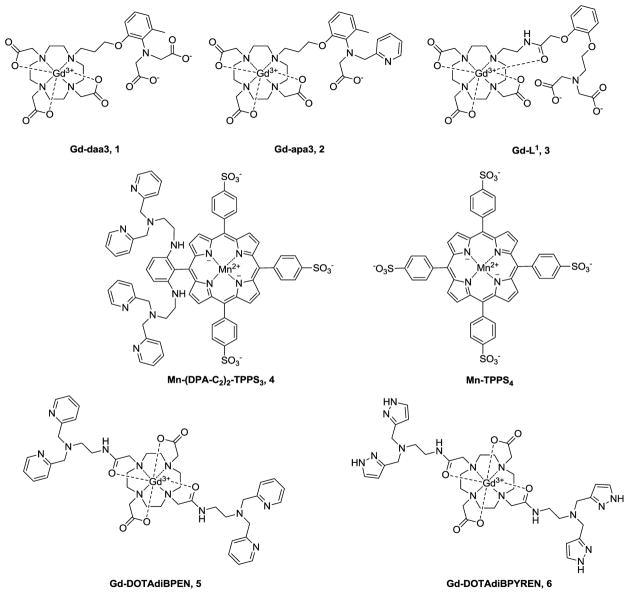
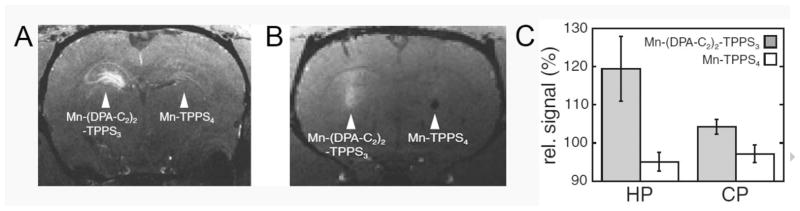
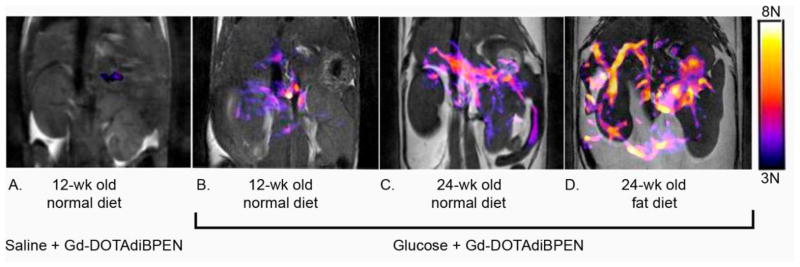
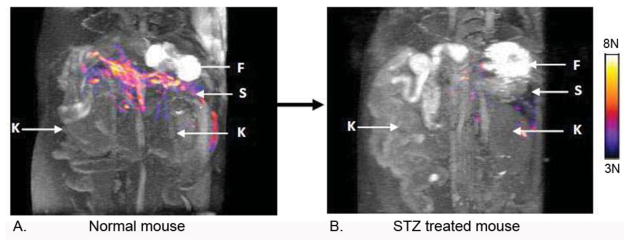
Our ever-expanding knowledge about the role of zinc in biology includes its role in redox modulation, immune response, neurotransmission, reproduction, diabetes, cancer, and Alzheimers disease is galvanizing interest in detecting and monitoring the various forms of Zn(II) in biological systems. This paper reviews reported strategies for detecting and tracking of labile or "free" unchelated Zn(II) in tissues. While different bound structural forms of Zn(II) have been identified and studied in vitro by multiple techniques, very few molecular imaging methods have successfully tracked the ion in vivo. A number of MRI and optical strategies have now been reported for detection of free Zn(II) in cells and tissues but only a few have been applied successfully in vivo. A recent report of a MRI sensor for in vivo tracking of Zn(II) released from pancreatic β-cells during insulin secretion exemplifies the promise of rational design of new Zn(II) sensors for tracking this biologically important ion in vivo. Such studies promise to provide new insights into zinc trafficking in vivo and the critical role of this ion in many human diseases.


Figures

Figure 1
Figure 1
A few MRI contrast agents that “respond” to the presence of Zn(II).
Figure 2
Figure 2
Contrast enhancement in representative rats, two days after injection of Mn-(DPA-C2)2-TPPS3 and Mn-TPPS4 into the left and right hemispheres of (A) hippocampus and (B) caudate-putamen. T1-weighted MRI data were acquired at 9.4 T with (A) 75×75×300 μm voxel size, TE/TR = 6/50 ms, FOV = 30×30×150 mm, and data matrix of 400×400×50 points (4-fold averaging, scan time = 37.3 min) and (B) with 150 μm cubic voxels, TE/TR = 6/50 ms, FOV = 30×30×22.5 mm, and data matrix of 200×200×150 points (no averaging, scan time = 15.5 min). (C) Relative MRI signal quantification in hippocampal (HP) and caudate (CP) regions near the injection sites of Mn-(DPA-C2)2-TPPS3 (gray) and Mn-TPPS4 (white). Both brain regions show significantly greater contrast enhancement with Mn-(DPA-C2)2-TPPS3 than with the control compound, but the difference is roughly three times greater on average in the zinc-rich hippocampus than in the caudate, which contains substantially less labile zinc. Error bars denote SEM for n = 6. Reprinted with permission from Elsevier, ref. [61], copyright 2010.
Figure 3
Figure 3
Representative grayscale T1-weighted MR images of a single slice through the abdomen that contains a portion of pancreatic tissue (1 mm slice w/o fat saturation) of 12- week old control animal after injection of saline followed by GdDOTA-diBPEN (A) and 12- week old control animal (B), 24-week old mice fed a standard 10% diet (C) or a 60% fat diet (D) over 12 weeks after injection of glucose followed by GdDOTA-diBPEN. The colored overlays represent a 3D composite of those pixels in each of fourteen slices where the water image intensity increased by 3-fold or more over the average noise after injection of saline plus agent or glucose plus agent. From ref. [64] copyright 2011.
Figure 4
Figure 4
Images of Zn(II) release during GSIS in a 12 week old control (A) versus a STZ-treated mouse (B). The color overlay represents the tissue areas where a contrast enhancement was observed after a bolus injection of GdDOTA-diBPEN and glucose. The colored image overlays reflect the same changes as noted in Fig. 3. The arrows refer to F = fundus stomach, S = spleen, K = kidneys. The images were collected from the same mouse before and 4 days after a single high-dose treatment of STZ. From ref. [64] copyright 2011.
Figure 5
Figure 5
Calculated plots of ΔR1 versus free Zn(II) levels (plots were calculated using the model defined in [62],[63]). The model assumes HSA = 600 μM, an extracellular concentration of Zn(II) sensor = 50 μM, and a modest increase in r1 of 40%.
Figure 6
Figure 6
A) Labile Zn(II) levels in different organs and media; prostate refers to values determined in the cytosol of prostate epithelial cells. B) pKDZn values of the Zn(II) MRI CAs reported in this account. C) pKDZn values of relevant biomolecules. Enzymes and structural proteins and Zn-transferrin pKD and labile Zn(II) in plasma and prostate cancer were obtained from[6], [–20], [85], and [72] respectively. Other values were obtained from references cited within the text.
Figure 7
Figure 7
Zn(II) binding moieties reported for fluorescent sensors. Numbers given below each compound correspond to KDZn values taken from [87]a, [88]b, [89]c, [90]d and [91]e, * corresponds to a value determined for analog compounds.
Figure 8
Figure 8
In vivo detection and monitoring of prostate cancer by epifluorescence whole-body optical imaging. A, noninvasive, whole-body epifluorescence optical imaging of 15-, 19-, 24-, and 28-wk-old TRAMP (bottom) and C57BL/6J (top) mice 30 min after tail-vein injection of ZPP1 (2.5 μmol/Kg if one assumes an average weight of 20 g for a 15 wk old mouse). In TRAMP mice, consistent with prostate cancer progression, there was an overall reduction in prostate-associated fluorescence with age, beginning at 19 wk of age. By contrast, the signal in the C57BL/6J mice remained the same (n = 4). Fluorescence efficiency relative to muscle tissue was normalized to 1. Reprinted by permission from the American Association for Cancer Research: S. K. Ghosh, P. Kim, X. A. Zhang, S. H. Yun, A. Moore, S. J. Lippard, Z. Medarova, A Novel Imaging Approach for Early Detection of Prostate Cancer Based on Endogenous Zinc Sensing, Cancer Res. 70, 6119–6127 (2010); 10.1158/0008-5472.CAN-10-1008.

References

    1. Andreini C, Banci L, Bertini I, Rosato A. J Proteome Res. 2006;5:3173–3178. - PubMed
    1. Tomat E, Lippard SJ. Curr Opin Chem Biol. 2010;14:225–230. - PMC - PubMed
    1. Kelleher SL, McCormick NH, Velasquez V, Lopez V. Adv Nutr. 2011;2:101–111. - PMC - PubMed
    1. Rink L, Gabriel P. P Nutr Soc. 2000;59:541–552. - PubMed
    1. Mills CF. Zinc in Human Biology. Springer-Verlag New York, LLC; New York: 1989.