

A hydration-based biophysical index for the onset of soil microbial coexistence
- PMID: 23181190
- PMCID: PMC3504331
- DOI: 10.1038/srep00881
A hydration-based biophysical index for the onset of soil microbial coexistence
Abstract
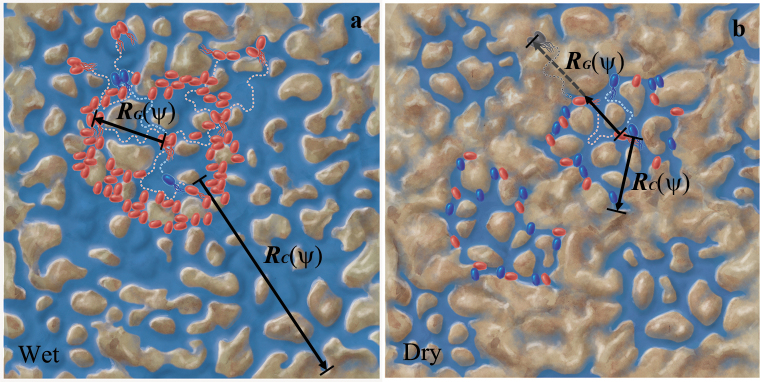
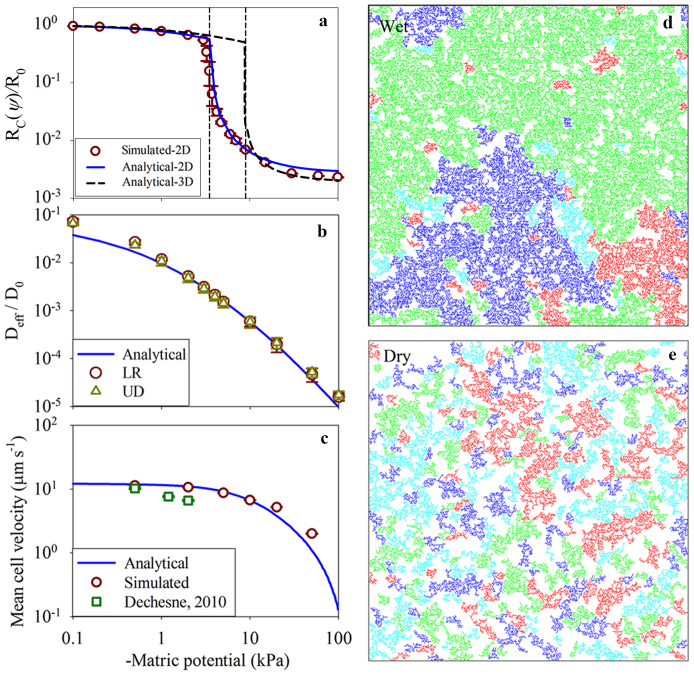
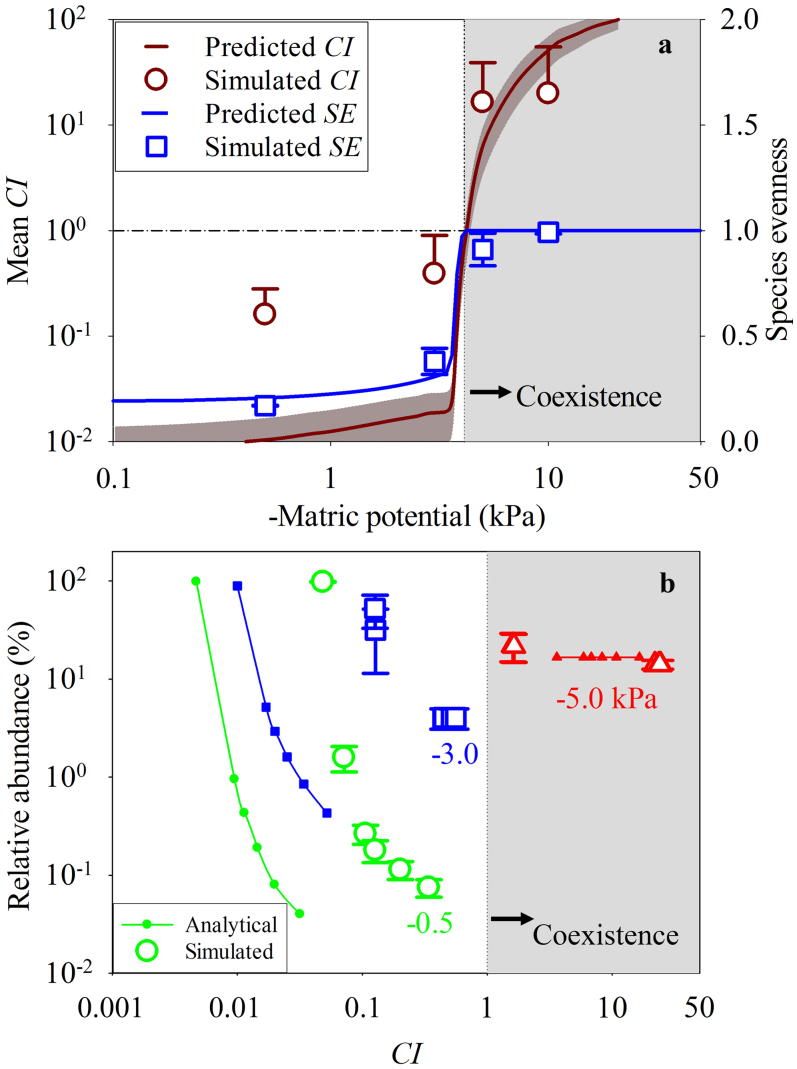
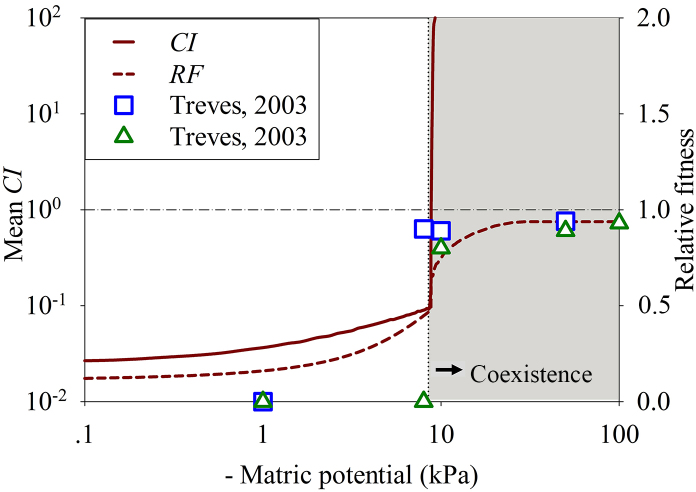
Mechanistic exploration of the origins of the unparalleled soil microbial biodiversity represents a vast and uncharted scientific frontier. Quantification of candidate mechanisms that promote and sustain such diversity must be linked with microbial functions and measurable biophysical interactions at appropriate scales. We report a novel microbial coexistence index (CI) that links macroscopic soil hydration conditions with microscale aquatic habitat fragmentation that impose restrictions on cell dispersion and growth rates of competing microbial populations cohabiting soil surfaces. The index predicts a surprisingly narrow range of soil hydration conditions that suppress microbial coexistence; and for most natural conditions found in soil hydration supports coexistence. The critical hydration conditions and relative abundances of competing species are consistent with limited experimental observations and with individual-based model simulations. The proposed metric offers a means for systematic evaluation of factors that regulate microbial coexistence in an ecologically consistent fashion.
Figures
Similar articles
-
Individual-Based Model of Microbial Life on Hydrated Rough Soil Surfaces.PLoS One. 2016 Jan 25;11(1):e0147394. doi: 10.1371/journal.pone.0147394. eCollection 2016. PLoS One. 2016. PMID: 26807803 Free PMC article.
-
Hydration dynamics promote bacterial coexistence on rough surfaces.ISME J. 2013 Feb;7(2):395-404. doi: 10.1038/ismej.2012.115. Epub 2012 Oct 11. ISME J. 2013. PMID: 23051694 Free PMC article.
-
Dynamics of microbial growth and coexistence on variably saturated rough surfaces.Microb Ecol. 2009 Aug;58(2):262-75. doi: 10.1007/s00248-009-9510-3. Epub 2009 Apr 8. Microb Ecol. 2009. PMID: 19352771
-
A review of diversity-stability relationship of soil microbial community: what do we not know?J Environ Sci (China). 2012;24(6):1027-35. doi: 10.1016/s1001-0742(11)60846-2. J Environ Sci (China). 2012. PMID: 23505870 Review.
-
Soil microbial diversity: Methodological strategy, spatial overview and functional interest.C R Biol. 2011 May;334(5-6):403-11. doi: 10.1016/j.crvi.2010.12.003. Epub 2011 Feb 15. C R Biol. 2011. PMID: 21640949 Review.
Cited by
-
Trophic interactions induce spatial self-organization of microbial consortia on rough surfaces.Sci Rep. 2014 Oct 24;4:6757. doi: 10.1038/srep06757. Sci Rep. 2014. PMID: 25343307 Free PMC article.
-
Individual-Based Model of Microbial Life on Hydrated Rough Soil Surfaces.PLoS One. 2016 Jan 25;11(1):e0147394. doi: 10.1371/journal.pone.0147394. eCollection 2016. PLoS One. 2016. PMID: 26807803 Free PMC article.
-
Artificial Soils Reveal Individual Factor Controls on Microbial Processes.mSystems. 2022 Aug 30;7(4):e0030122. doi: 10.1128/msystems.00301-22. Epub 2022 Jul 26. mSystems. 2022. PMID: 35880897 Free PMC article.
-
The Impact of Hydration and Temperature on Bacterial Diversity in Arid Soil Mesocosms.Front Microbiol. 2017 Jun 14;8:1078. doi: 10.3389/fmicb.2017.01078. eCollection 2017. Front Microbiol. 2017. PMID: 28659896 Free PMC article.
-
Biophysical processes supporting the diversity of microbial life in soil.FEMS Microbiol Rev. 2017 Sep 1;41(5):599-623. doi: 10.1093/femsre/fux039. FEMS Microbiol Rev. 2017. PMID: 28961933 Free PMC article. Review.
References
-
- Fenchel T. Microbial behavior in a heterogeneous world. Science 296, 1068–1071 (2002). - PubMed
-
- Torsvik V., Øvreås L. & Thingstad T. F. Prokaryotic diversity – magnitude, dynamics, and controlling factors. Science 296, 1064–1066 (2002). - PubMed
-
- Young I. M., Crawford J. W., Nunan N., Otten W. & Spiers A. in Advances in Agronomy, Sparks D. L., ed. (Academic Press, Burlington, 2008). pp. 81.
Publication types
MeSH terms
Substances
LinkOut - more resources
Full Text Sources
