

doi: 10.1063/1.4766356.
Core and valence excitations in resonant X-ray spectroscopy using restricted excitation window time-dependent density functional theory
Affiliations
- PMID: 23181305
- PMCID: PMC3517496
- DOI: 10.1063/1.4766356
Item in Clipboard
Core and valence excitations in resonant X-ray spectroscopy using restricted excitation window time-dependent density functional theory
J Chem Phys.
.
Abstract
We report simulations of X-ray absorption near edge structure (XANES), resonant inelastic X-ray scattering (RIXS) and 1D stimulated X-ray Raman spectroscopy (SXRS) signals of cysteine at the oxygen, nitrogen, and sulfur K and L(2,3) edges. Comparison of the simulated XANES signals with experiment shows that the restricted window time-dependent density functional theory is more accurate and computationally less expensive than the static exchange method. Simulated RIXS and 1D SXRS signals give some insights into the correlation of different excitations in the molecule.
Figures

Calculated XANES spectra of cysteine taken at the nitrogen, oxygen, and sulfur K-edges (solid red traces), from either the REW-TDDFT (top) or STEX (bottom) level of theory, compared with experimental spectra (solid blue traces) adapted from Refs. and . In plotting the calculated absorption, the stick spectrum (black lines) is convoluted with a Lorentzian function with an energy-dependent linewidth, Γe, whose value is given by the dashed green trace (the same Γe is used for both REW-TDDFT and STEX).

Calculated UV absorption spectrum of cysteine from TDDFT. The same active valence excitations contribute to the Raman signals shown below.

Calculated RIXS signal at the nitrogen K-edge, oxygen K-edge, sulfur K-edge, and sulfur L-edge from cysteine. The excitation frequency ω1 is given with respect to the K-edge frequency.
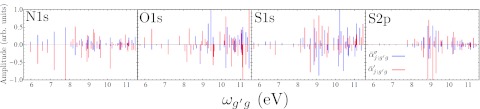
Hermitian and anti-Hermitian parts of the effective isotropic polarizabilities (Eq. 14) for the four pulses used in our simulations, in arbitrary units. The Hermitian part is purely real, while the anti-Hermitian part is purely imaginary.

1D SXRS spectra from cysteine with the two pulses polarized at the magic angle. The pulses are Gaussian, with bandwidth 14 eV, FWHM. The center frequency of the pulses is set to the core edge frequency for a given atom. Spectra in the same row share a common pump pulse, while spectra in the same column share a common probe pulse.

(Top row) The N1s/O1s (solid traces) and O1s/N1s (dashed traces) signals, shown as the real (left), imaginary (middle), and modulus (right) of the Fourier transform signal. As shown in the text, differences between these signals are related to the complex valued polarizability when the pulses are near resonance with multiple core transitions. The real and imaginary FT signals are both mixtures of dispersive and Lorentzian lineshapes. (Bottom row) The left and middle panels show the imaginary and real parts of the FT difference spectra. Unlike the top row, here the imaginary part is purely absorptive and the real part purely dispersive. The right panel shows both the modulus of the difference signal (solid trace), and the difference of the modulus signals (dashed trace). Peaks for which the solid trace is large in value, but the dashed trace is not, indicate that the two signals have similar magnitude for a given peak but have a large phase difference. Peaks for which the two traces are similar in magnitude indicate that the phase and amplitude for that peak are different for the two pulse configurations.

Difference 1D-SXRS spectra for the six possible two-color combinations considered here. The top middle panel, for example, shows the modulus of the difference between the N1s/S1s and S1s/N1s signals as the solid trace, and the difference between the moduli of the N1s/S1s and S1s/N1s signals as the dashed trace.
Similar articles
-
Multidimensional x-ray spectroscopy of valence and core excitations in cysteine.J Chem Phys. 2013 Apr 14;138(14):144303. doi: 10.1063/1.4799266. J Chem Phys. 2013. PMID: 24981531 Free PMC article.
-
Resonant inelastic x-ray scattering of CeB6 at the Ce L(1)- and L(3)-edges.J Chem Phys. 2012 May 21;136(19):194501. doi: 10.1063/1.4716180. J Chem Phys. 2012. PMID: 22612097
-
K- and L-edge X-ray Absorption Spectroscopy (XAS) and Resonant Inelastic X-ray Scattering (RIXS) Determination of Differential Orbital Covalency (DOC) of Transition Metal Sites.Coord Chem Rev. 2017 Aug 15;345:182-208. doi: 10.1016/j.ccr.2017.02.004. Epub 2017 Feb 9. Coord Chem Rev. 2017. PMID: 28970624 Free PMC article.
-
Computational approaches for XANES, VtC-XES, and RIXS using linear-response time-dependent density functional theory based methods.Phys Chem Chem Phys. 2022 Jun 22;24(24):14680-14691. doi: 10.1039/d2cp01132h. Phys Chem Chem Phys. 2022. PMID: 35699090 Review.
-
Synchrotron ultrafast techniques for photoactive transition metal complexes.Philos Trans A Math Phys Eng Sci. 2013 Jun 17;371(1995):20120132. doi: 10.1098/rsta.2012.0132. Print 2013 Jul 28. Philos Trans A Math Phys Eng Sci. 2013. PMID: 23776294 Review.
Cited by
-
Understanding Excitation Energy Transfer in Metalloporphyrin Heterodimers with Different Linkers, Bonding Structures and Geometries through Stimulated X-Ray Raman Spectroscopy.J Mod Opt. 2014 Jan 1;61(7):558-567. doi: 10.1080/09500340.2014.899734. J Mod Opt. 2014. PMID: 25045204 Free PMC article.
-
Nonlinear light scattering in molecules triggered by an impulsive X-ray Raman process.Phys Rev A. 2013 May 1;87(5):53826. doi: 10.1103/PhysRevA.87.053826. Phys Rev A. 2013. PMID: 24465122 Free PMC article.
-
Ultrafast Spectroscopy of Photoactive Molecular Systems from First Principles: Where We Stand Today and Where We Are Going.J Am Chem Soc. 2020 Sep 23;142(38):16117-16139. doi: 10.1021/jacs.0c04952. Epub 2020 Sep 13. J Am Chem Soc. 2020. PMID: 32841559 Free PMC article.
-
Covalency in actinide(iv) hexachlorides in relation to the chlorine K-edge X-ray absorption structure.Chem Sci. 2022 Feb 9;13(11):3194-3207. doi: 10.1039/d1sc06454a. eCollection 2022 Mar 16. Chem Sci. 2022. PMID: 35414875 Free PMC article.
-
Double-Hybrid Density Functional Theory for Core Excitations: Theory and Benchmark Calculations.J Chem Theory Comput. 2023 Feb 28;19(4):1310-1321. doi: 10.1021/acs.jctc.2c01222. Epub 2023 Jan 31. J Chem Theory Comput. 2023. PMID: 36721871 Free PMC article.
References
-
- Doumy G., Roedig C., Son S.-K., Blaga C. I., DiChiara A. D., Santra R., Berrah N., Bostedt C., Bozek J. D., Bucksbaum P. H., Cryan J. P., Fang L., Ghimire S., Glownia J. M., Hoener M., Kanter E. P., Krässig B., Kuebel M., Messerschmidt M., Paulus G. G., Reis D. A., Rohringer N., Young L., Agostini P., and DiMauro L. F., Phys. Rev. Lett. 106, 083002 (2011).10.1103/PhysRevLett.106.083002 - DOI - PubMed
-
- Marangos J., Contemp. Phys. 52, 551 (2011).10.1080/00107514.2011.607290 - DOI
-
- Hoener M., Fang L., Kornilov O., Gessner O., Pratt S. T., Ghr M., Kanter E. P., Blaga C., Bostedt C., Bozek J. D., Bucksbaum P. H., Buth C., Chen M., Coffee R., Cryan J., DiMauro L., Glownia M., Hosler E., Kukk E., Leone S. R., McFarland B., Messerschmidt M., Murphy B., Petrovic V., Rolles D., and Berrah N., Phys. Rev. Lett. 104, 253002 (2010).10.1103/PhysRevLett.104.253002 - DOI - PubMed
Publication types
MeSH terms
Substances
Grants and funding
LinkOut - more resources
Full Text Sources