Atomistic simulations of pH-dependent self-assembly of micelle and bilayer from fatty acids
- PMID: 23181330
- PMCID: PMC3517497
- DOI: 10.1063/1.4766313
Atomistic simulations of pH-dependent self-assembly of micelle and bilayer from fatty acids
Abstract
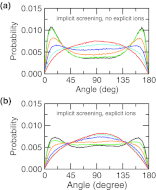
Detailed knowledge of the self-assembly and phase behavior of pH-sensitive surfactants has implications in areas such as targeted drug delivery. Here we present a study of the formation of micelle and bilayer from lauric acids using a state-of-the-art simulation technique, continuous constant pH molecular dynamics (CpHMD) with conformational sampling in explicit solvent and the pH-based replica-exchange protocol. We find that at high pH conditions a spherical micelle is formed, while at low pH conditions a bilayer is formed with a considerable degree of interdigitation. The mid-point of the phase transition is in good agreement with experiment. Preliminary investigation also reveals that the effect of counterions and salt screening shifts the transition mid-point and does not change the structure of the surfactant assembly. Based on these data we suggest that CpHMD simulations may be applied to computational design of surfactant-based nano devices in the future.
Figures


Similar articles
-
Self-assembly and bilayer-micelle transition of fatty acids studied by replica-exchange constant pH molecular dynamics.Langmuir. 2013 Dec 3;29(48):14823-30. doi: 10.1021/la403398n. Epub 2013 Nov 20. Langmuir. 2013. PMID: 24215478 Free PMC article.
-
Predicting proton titration in cationic micelle and bilayer environments.J Chem Phys. 2014 Aug 28;141(8):084714. doi: 10.1063/1.4893439. J Chem Phys. 2014. PMID: 25173037 Free PMC article.
-
Molecular-dynamics simulation of amphiphilic bilayer membranes and wormlike micelles: a multi-scale modelling approach to the design of viscoelastic surfactant solutions.Philos Trans A Math Phys Eng Sci. 2004 Aug 15;362(1821):1625-38. doi: 10.1098/rsta.2004.1399. Philos Trans A Math Phys Eng Sci. 2004. PMID: 15306435
-
Mixed micelles and other structures in the solubilization of bilayer lipid membranes by surfactants.Biochim Biophys Acta. 2000 Nov 23;1508(1-2):146-63. doi: 10.1016/s0005-2736(00)00309-6. Biochim Biophys Acta. 2000. PMID: 11090823 Review.
-
Complementary use of simulations and molecular-thermodynamic theory to model micellization.Langmuir. 2006 Feb 14;22(4):1500-13. doi: 10.1021/la052042c. Langmuir. 2006. PMID: 16460068 Review.
Cited by
-
Effect of monovalent salt concentration and peptide secondary structure in peptide-micelle binding.RSC Adv. 2021 Nov 17;11(58):36836-36849. doi: 10.1039/d1ra06772a. eCollection 2021 Nov 10. RSC Adv. 2021. PMID: 35494385 Free PMC article.
-
Self-assembly and bilayer-micelle transition of fatty acids studied by replica-exchange constant pH molecular dynamics.Langmuir. 2013 Dec 3;29(48):14823-30. doi: 10.1021/la403398n. Epub 2013 Nov 20. Langmuir. 2013. PMID: 24215478 Free PMC article.
-
A Fast and Interpretable Deep Learning Approach for Accurate Electrostatics-Driven pKa Predictions in Proteins.J Chem Theory Comput. 2022 Aug 9;18(8):5068-5078. doi: 10.1021/acs.jctc.2c00308. Epub 2022 Jul 15. J Chem Theory Comput. 2022. PMID: 35837736 Free PMC article.
-
New Lyotropic Complex Fluid Structured in Sheets of Ellipsoidal Micelles Solubilizing Fragrance Oils.ACS Omega. 2023 Jul 31;8(32):29568-29584. doi: 10.1021/acsomega.3c03500. eCollection 2023 Aug 15. ACS Omega. 2023. PMID: 37599987 Free PMC article.
-
Dynamic Protonation Dramatically Affects the Membrane Permeability of Drug-like Molecules.J Am Chem Soc. 2019 Aug 28;141(34):13421-13433. doi: 10.1021/jacs.9b04387. Epub 2019 Aug 16. J Am Chem Soc. 2019. PMID: 31382734 Free PMC article.
References
-
- Kanicky J. R. and Shah D. O., Langmuir 19, 2034 (2003).10.1021/la020672y - DOI
Publication types
MeSH terms
Substances
Grants and funding
LinkOut - more resources
Full Text Sources

