. 2012 Nov 26;9(1):105.
doi: 10.1186/1743-7075-9-105.

Green tea powder and Lactobacillus plantarum affect gut microbiota, lipid metabolism and inflammation in high-fat fed C57BL/6J mice

Affiliations

Green tea powder and Lactobacillus plantarum affect gut microbiota, lipid metabolism and inflammation in high-fat fed C57BL/6J mice

Ulrika Axling et al. Nutr Metab (Lond). .

Abstract

Background: Type 2 diabetes is associated with obesity, ectopic lipid accumulation and low-grade inflammation. A dysfunctional gut microbiota has been suggested to participate in the pathogenesis of the disease. Green tea is rich in polyphenols and has previously been shown to exert beneficial metabolic effects. Lactobacillus plantarum has the ability to metabolize phenolic acids. The health promoting effect of whole green tea powder as a prebiotic compound has not been thoroughly investigated previously.

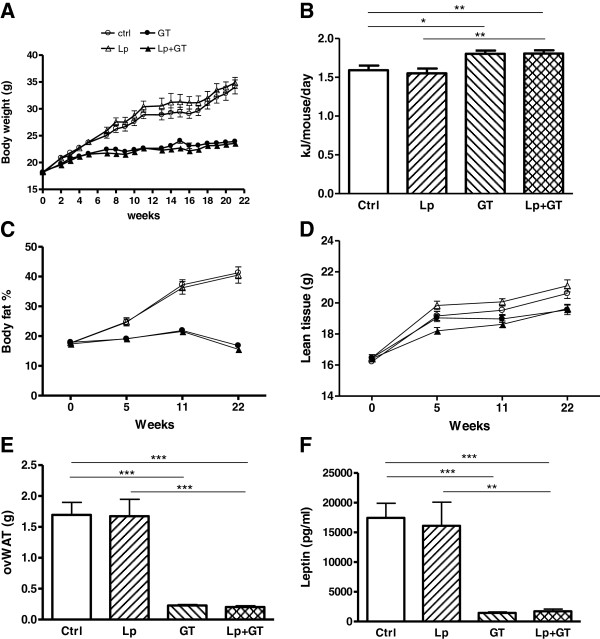
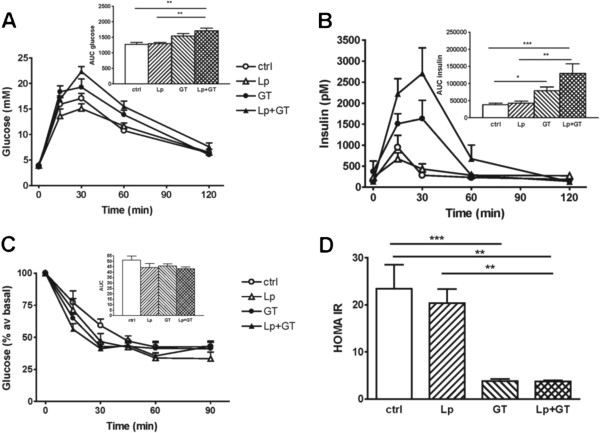
Methods: C57BL/6J mice were fed a high-fat diet with or without a supplement of 4% green tea powder (GT), and offered drinking water supplemented with Lactobacillus plantarum DSM 15313 (Lp) or the combination of both (Lp + GT) for 22 weeks. Parameters related to obesity, glucose tolerance, lipid metabolism, hepatic steatosis and inflammation were examined. Small intestinal tissue and caecal content were collected for bacterial analysis.

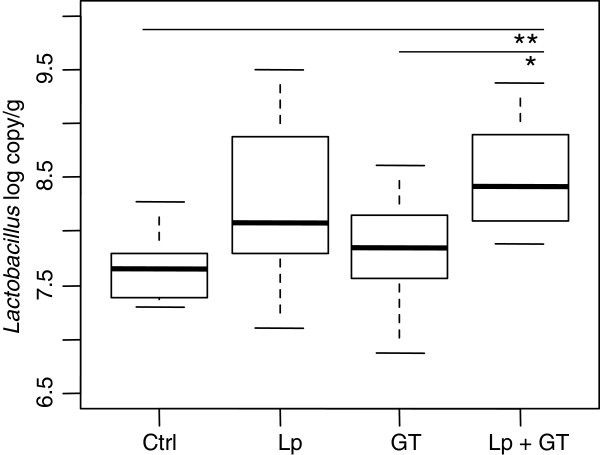
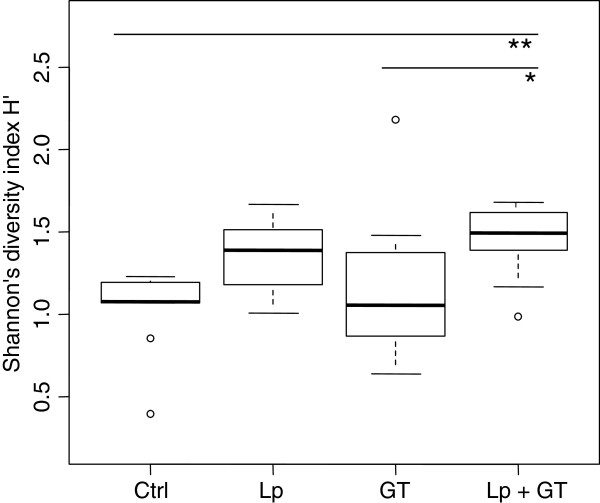
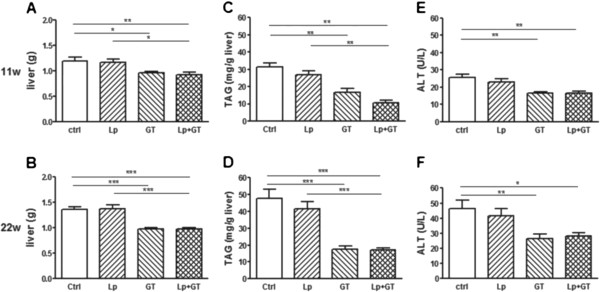
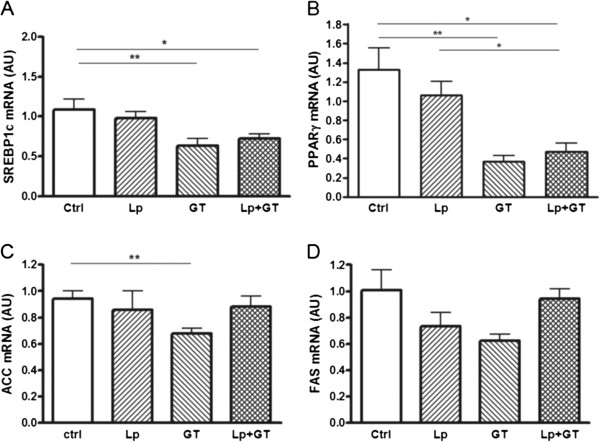
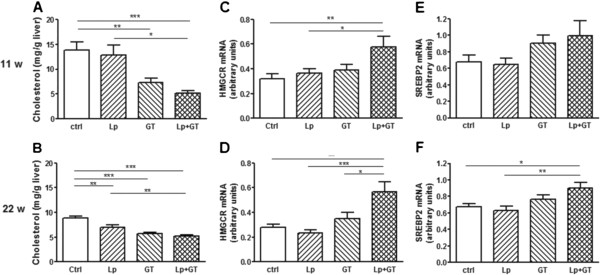
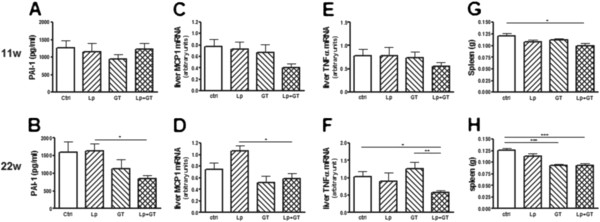
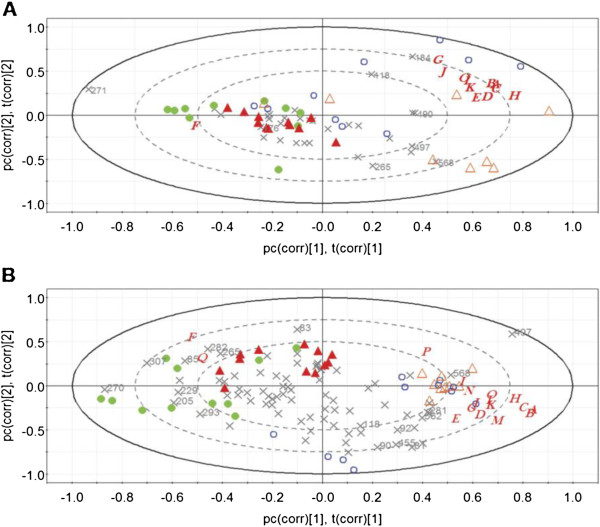
Results: Mice in the Lp + GT group had significantly more Lactobacillus and higher diversity of bacteria in the intestine compared to both mice in the control and the GT group. Green tea strongly reduced the body fat content and hepatic triacylglycerol and cholesterol accumulation. The reduction was negatively correlated to the amount of Akkermansia and/or the total amount of bacteria in the small intestine. Markers of inflammation were reduced in the Lp + GT group compared to control. PLS analysis of correlations between the microbiota and the metabolic variables of the individual mice showed that relatively few components of the microbiota had high impact on the correlation model.

Conclusions: Green tea powder in combination with a single strain of Lactobacillus plantarum was able to promote growth of Lactobacillus in the intestine and to attenuate high fat diet-induced inflammation. In addition, a component of the microbiota, Akkermansia, correlated negatively with several metabolic parameters known to be risk factors for the development of type 2 diabetes.


Figures

Figure 1
Figure 1
Quantification (PCR-copies) of Lactobacillus in small intestinal tissue after 22 weeks. Significant differences were reached for Lactobacillus between the control group and the Lp + GT group (p = 0.002), and between the groups receiving GT and Lp + GT (p = 0.04). Ctrl = high fat control diet (HFD), Lp = HFD + L. plantarum in the drinking water, GT = HFD supplemented with 4% green tea powder, Lp + GT = HFD supplemented with 4% green tea powder and L. plantarum in the drinking water.
Figure 2
Figure 2
Bacterial diversity in the small intestine after 22 weeks. The data is based on T-RFLP-profiles and Msp1 digestion. The area of each peak, expressed as the proportion of the total area, was used for calculation of the Shannon diversity index. Control vs. Lp + GT (p = 0.008), GT vs. Lp + GT (p = 0.04).
Figure 3
Figure 3
Decreased adiposity in mice fed a diet supplemented with green tea. (A) Weekly body weight registration during the 22 week study. (B) Average energy intake calculated as KJ/mouse/day. (C) Relative body fat content (%) recorded using DEXA scan technique at week 0, 5, 11 and 22. (D) Lean body mass measured with DEXA at 0, 5, 11 and 22 weeks. (E) Periovarian white adipose tissue weight and (F) plasma leptin concentration after 22 weeks on the different diets. Ctrl = high fat control diet (HFD), Lp = HFD + L. plantarum in the drinking water, GT = HFD supplemented with 4% green tea powder, Lp + GT = HFD supplemented with 4% green tea powder and L. plantarum in the drinking water. Data are means ± SEM n = 21 at 11 weeks and n = 9–11 at 22 weeks. *p < 0.05, **p < 0.01, ***p < 0.001.
Figure 4
Figure 4
Altered glucose and insulin tolerance by supplementing the diet with green tea. (A) Plasma glucose and (B) insulin concentrations in an oral glucose tolerance test performed at week 8. Mean values and SEM for 11 mice in each group. (C) Plasma glucose expressed as % of basal after an intraperitoneal injection of insulin at week 15. Mean values and SEM for 9–11 mice in each group. No differences were detected between any of the four groups. The areas under the curves (AUC) are shown in the insets (D) HOMA-IR index at week 22. The index was calculated by multiplying fasting glucose (mM) and fasting insulin (μU/ml) divided by 22.5. Ctrl = high fat control diet (HFD), Lp = HFD + L. plantarum in the drinking water, GT = HFD supplemented with 4% green tea powder, Lp + GT = HFD supplemented with 4% green tea powder and L. plantarum in the drinking water. Data are means ± SEM for 9–11 mice/group. *p < 0.05, **p < 0.01, ***p < 0.001.
Figure 5
Figure 5
Improved liver phenotype in mice fed a diet supplemented with green tea. Liver weights after 11 (A) and 22 (B) weeks on the different diets. Triacylglycerol (TAG) content in liver after 11 (C) and 22 (D) weeks, respectively. The concentration of the liver enzyme ALT measured in plasma after 11 (E) and 22 (F) weeks. Ctrl = high fat control diet (HFD), Lp = HFD + L. plantarum in the drinking water, GT = HFD supplemented with 4% green tea powder, Lp + GT = HFD supplemented with 4% green tea powder and L. plantarum in the drinking water. Data are means ± SEM for n = 21 at 11 weeks and n = 9–11 at 22 weeks. *p < 0.05, **p < 0.01, ***p < 0.001.
Figure 6
Figure 6
Decreased lipogenic gene expression in liver of mice fed a diet supplemented with green tea. Hepatic mRNA expression of sterol regulatory-binding protein 1c (SREBP1c, A), peroxisome proliferator-activated receptor γ (PPARγ, B), acetyl CoA carboxylase (ACC, C) and fatty acid synthase (FAS, D) was quantified with real-time PCR after 22 weeks of the different diets. Ctrl = high fat control diet (HFD), Lp = HFD + L. plantarum in the drinking water, GT = HFD supplemented with 4% green tea powder, Lp + GT = HFD supplemented with 4% green tea powder and L. plantarum in the drinking water. Data are means ± SEM. n = 9–11 at 22 weeks. *p < 0.05, **p < 0.01.
Figure 7
Figure 7
Altered cholesterol homeostasis in mice fed a diet supplemented with green tea andLactobacillus plantarum. Total cholesterol content in liver after 11 (A) and 22 (B) weeks on the different diets. Hepatic mRNA expression of hydroxy-methyl-glutaryl-CoA reductase (HMGCR, C and D) and sterol regulatory-binding protein 2 (SREBP2, E and F) after 11 and 22 weeks respectively. Ctrl = high fat control diet (HFD), Lp = HFD + L. plantarum in the drinking water, GT = HFD supplemented with 4% green tea powder, Lp + GT = HFD supplemented with 4% green tea powder and L. plantarum in the drinking water. Data are means ± SEM. n = 21 at 11 weeks and n = 9–11 at 22 weeks. *p < 0.05, **p < 0.01, ***p < 0.001.
Figure 8
Figure 8
Decreased inflammatory markers in mice fed a combination of green tea andLactobacillus plantarum. The inflammatory marker PAI-1 was analyzed in plasma after 11 (A) and 22 (B) weeks using Luminex Technology. Quantitative real-time PCR was used to analyze the liver mRNA expression of the inflammatory markers monocyte chemoattractant protein 1 (MCP-1, C and D) and tumor necrosing factor α (TNF-α, E and F) after 11 and 22 weeks of the study. Spleen masses were analyzed as a reflection of inflammatory activity (G and H). Ctrl = high fat control diet (HFD), Lp = HFD + L. plantarum in the drinking water, GT = HFD supplemented with 4% green tea powder, Lp + GT = HFD supplemented with 4% green tea powder and L. plantarum in the drinking water. Data are means ± SEM. n = 21 at 11 weeks and n = 9–11 at 22 weeks. *p < 0.05, **p < 0.01, ***p < 0.001.
Figure 9
Figure 9
PLS plot of the intestinal microbiota and analyzed parameters of individual mice at 22 weeks. Projections to latent structures (PLS) loadings biplot of the microbiota (T-RFs of the T-RFLP profile) and the physiological parameters (A through Q) of the individual mice in the small intestine (A) and caecum (B). For the small intestine PC1 explained 25.6% and PC2 15.6% of the variation. For caecum the PC1 explained 26.4% and PC2 16.4% of the variation. Blue open circle represents mice in the control group (Ctrl); orange open triangle for the group supplemented with L. plantarum DSM 15313 (Lp); green dot for the group supplemented green tea (GT); red triangle for the group supplemented L. plantarum DSM 15313 and green tea (Lp + GT). Letters denote metabolic parameters, A, body weight; B, body fat content; C, periovarian white adipose tissue; D, liver weight; E, spleen weight; F, caecum weight; G, liver cholesterol; H, liver TAG; I, plasma ALT; J, plasma cholesterol; K, plasma insulin; L, plasma glucose; M, plasma leptin; N, PPARα mRNA; O, PPARγ mRNA; P, CD36 mRNA; Q, SR-B1 mRNA. Symbol X denotes T-RFs. T-RFs having the biggest influence on the model are marked by numbers indicating the fragment size.

References

    1. Shaw JE, Sicree RA, Zimmet PZ. Global estimates of the prevalence of diabetes for 2010 and 2030. Diabetes Res Clin Pract. 2010;87:4–14. doi: 10.1016/j.diabres.2009.10.007. - DOI - PubMed
    1. Smith BW, Adams LA. Nonalcoholic fatty liver disease and diabetes mellitus, pathogenesis and treatment. Nat Rev Endocrinol. 2011;7:456–465. doi: 10.1038/nrendo.2011.72. - DOI - PubMed
    1. Backhed F, Ding H, Wang T, Hooper LV, Koh GY, Nagy A, Semenkovich CF, Gordon JI. The gut microbiota as an environmental factor that regulates fat storage. Proc Natl Acad Sci USA. 2004;101:15718–15723. doi: 10.1073/pnas.0407076101. - DOI - PMC - PubMed
    1. Larsen N, Vogensen FK, van den Berg FW, Nielsen DS, Andreasen AS, Pedersen BK, Al-Soud WA, Sorensen SJ, Hansen LH, Jakobsen M. Gut microbiota in human adults with type 2 diabetes differs from non-diabetic adults. PLoS One. 2010;5:e9085. doi: 10.1371/journal.pone.0009085. - DOI - PMC - PubMed
    1. Turnbaugh PJ, Backhed F, Fulton L, Gordon JI. Diet-induced obesity is linked to marked but reversible alterations in the mouse distal gut microbiome. Cell Host Microbe. 2008;3:213–223. doi: 10.1016/j.chom.2008.02.015. - DOI - PMC - PubMed

LinkOut - more resources