

Disrupted correlation between low frequency power and connectivity strength of resting state brain networks in schizophrenia
- PMID: 23182443
- PMCID: PMC3540119
- DOI: 10.1016/j.schres.2012.11.001
Disrupted correlation between low frequency power and connectivity strength of resting state brain networks in schizophrenia
Abstract
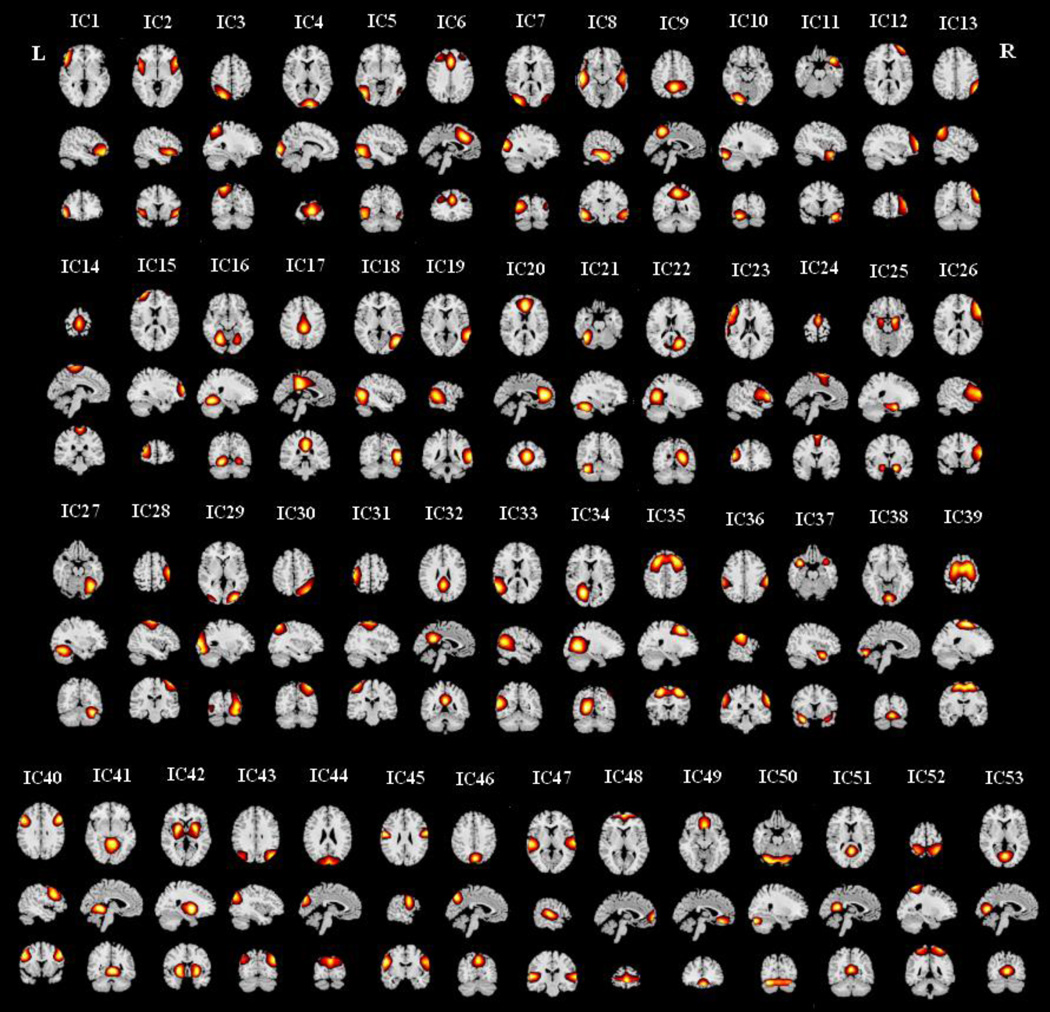
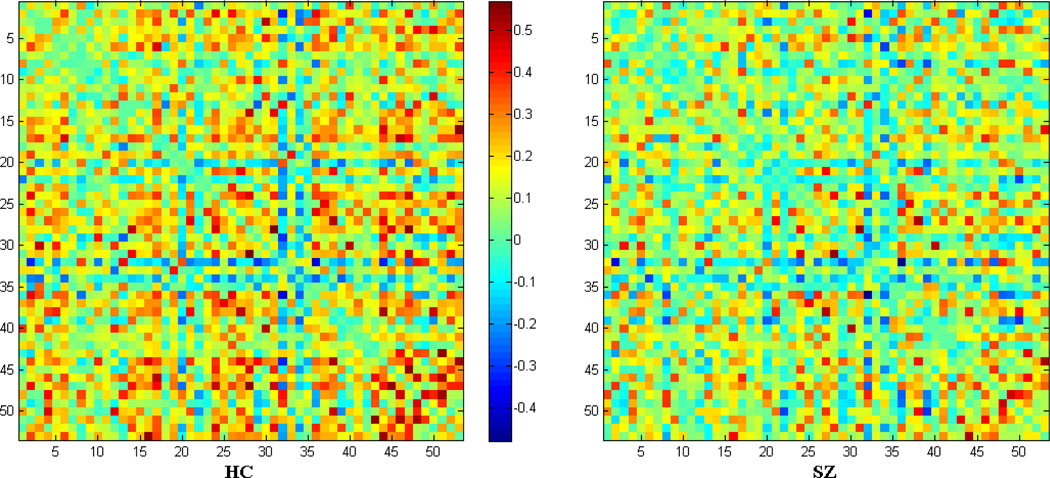
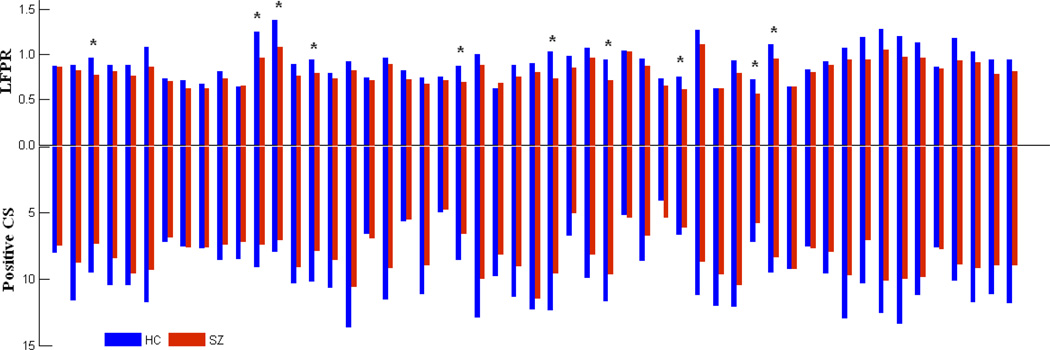
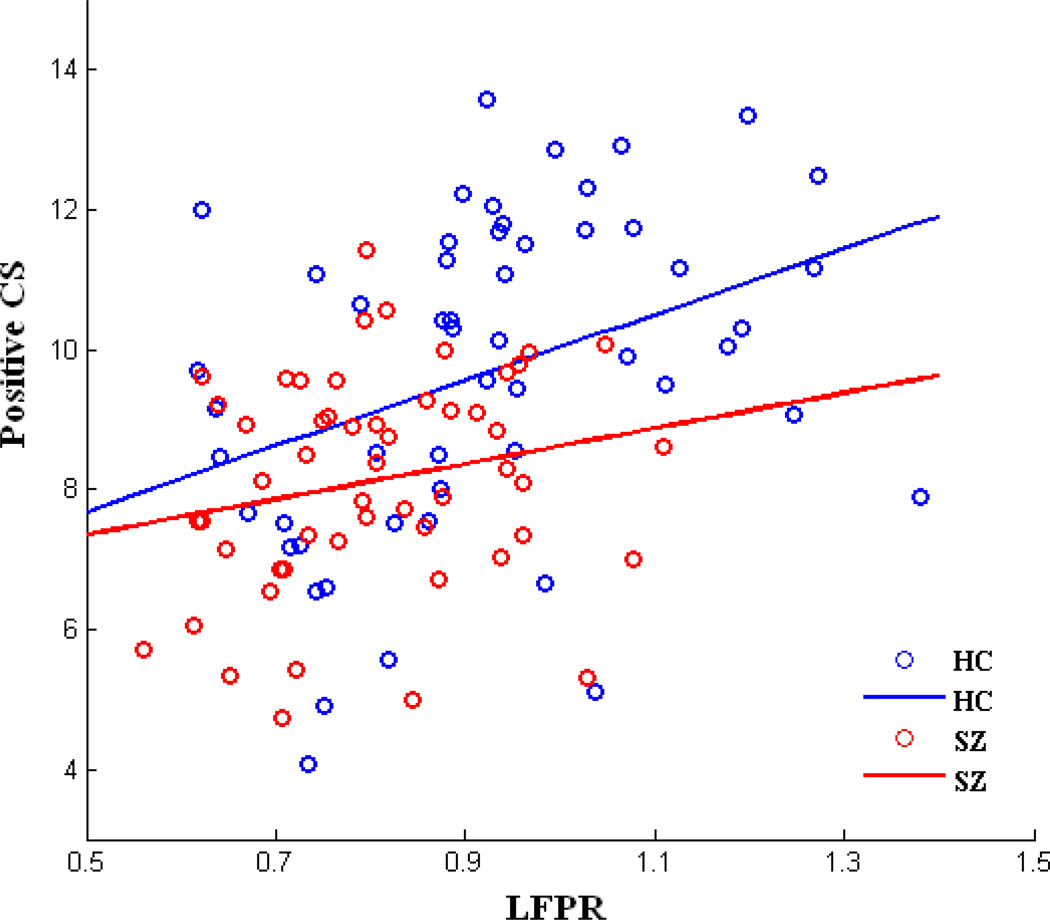
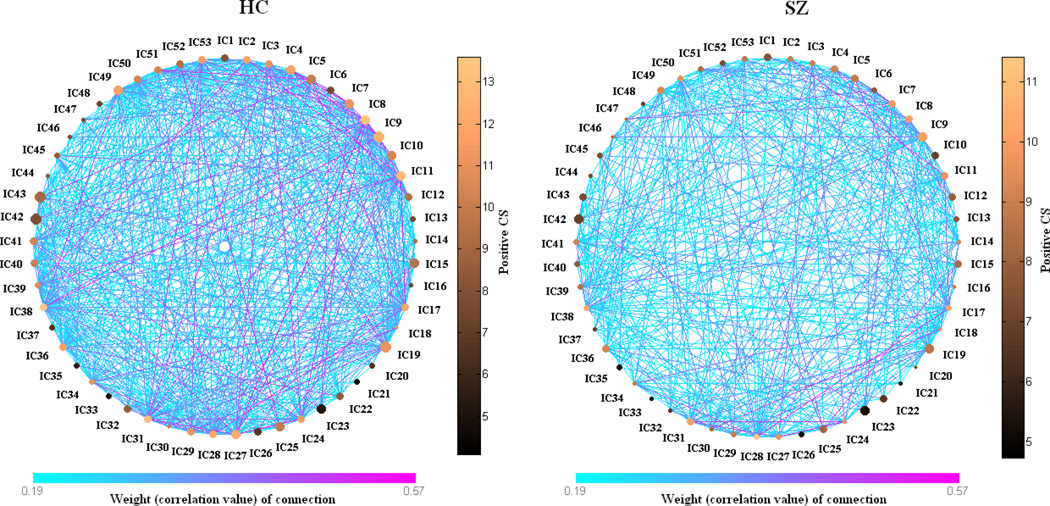
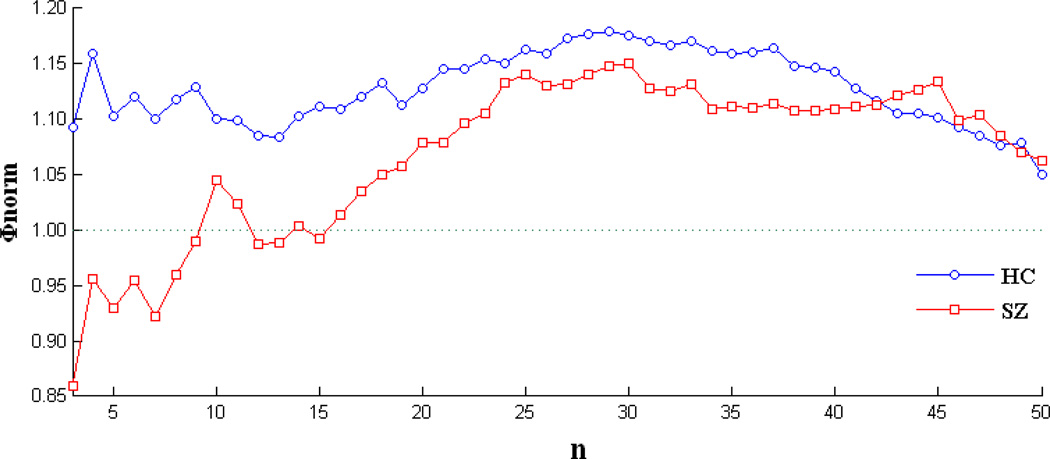
Altered brain connectivity has emerged as a central feature of schizophrenia. Low frequency oscillations and connectivity strength (CS) of resting state brain networks are altered in patients with schizophrenia (SZs). However, the relationship between these two measures has not yet been studied. Such work may be helpful in understanding the so-called "rich club" organization (i.e. high-CS nodes are more densely connected among themselves than are nodes of a lower CS in the human brain) in healthy controls (HCs) and SZs. Here we present a study of HCs and SZs examining low frequency oscillations and CS by first decomposing resting state fMRI (R-fMRI) data into independent components (ICs) using group independent component analysis (ICA) and computing the low frequency power ratio (LFPR) of each ICA time course. Weighted brain graphs consisting of ICs were built based on correlations between ICA time courses. Positive CS and negative CS of each node in the brain graphs were then examined. The correlations between LFPR and CSs as well as "rich club" coefficients of group mean brain graphs were assessed. Results demonstrate that the LFPR of some ICs were lower in SZs compared to HCs. In addition, LFPR was correlated with positive CS in HCs, but to a lesser extent in SZs. HCs showed higher normalized rich club parameter than SZs. The findings provide new insight into disordered intrinsic brain graphs in schizophrenia.
Copyright © 2012 Elsevier B.V. All rights reserved.
Conflict of interest statement
All authors declare that they have no conflicts of interest.
Figures
Similar articles
-
State-related functional integration and functional segregation brain networks in schizophrenia.Schizophr Res. 2013 Nov;150(2-3):450-8. doi: 10.1016/j.schres.2013.09.016. Epub 2013 Oct 2. Schizophr Res. 2013. PMID: 24094882 Free PMC article.
-
Assessing dynamic brain graphs of time-varying connectivity in fMRI data: application to healthy controls and patients with schizophrenia.Neuroimage. 2015 Feb 15;107:345-355. doi: 10.1016/j.neuroimage.2014.12.020. Epub 2014 Dec 13. Neuroimage. 2015. PMID: 25514514 Free PMC article.
-
Modular Organization of Functional Network Connectivity in Healthy Controls and Patients with Schizophrenia during the Resting State.Front Syst Neurosci. 2012 Jan 10;5:103. doi: 10.3389/fnsys.2011.00103. eCollection 2011. Front Syst Neurosci. 2012. PMID: 22275887 Free PMC article.
-
Away from home: the brain of the wandering mind as a model for schizophrenia.Schizophr Res. 2015 Jun;165(1):83-9. doi: 10.1016/j.schres.2015.03.021. Epub 2015 Apr 10. Schizophr Res. 2015. PMID: 25864955
-
Resting-state fMRI functional connectivity: a new perspective to evaluate pain modulation in migraine?Neurol Sci. 2015 May;36 Suppl 1:41-5. doi: 10.1007/s10072-015-2145-x. Neurol Sci. 2015. PMID: 26017510 Review.
Cited by
-
Glucose metabolism during resting state reveals abnormal brain networks organization in the Alzheimer's disease and mild cognitive impairment.PLoS One. 2013 Jul 23;8(7):e68860. doi: 10.1371/journal.pone.0068860. Print 2013. PLoS One. 2013. PMID: 23894356 Free PMC article.
-
GRETNA: a graph theoretical network analysis toolbox for imaging connectomics.Front Hum Neurosci. 2015 Jun 30;9:386. doi: 10.3389/fnhum.2015.00386. eCollection 2015. Front Hum Neurosci. 2015. PMID: 26175682 Free PMC article.
-
Evolution of spatial and temporal features of functional brain networks across the lifespan.Neuroimage. 2018 Jun;173:498-508. doi: 10.1016/j.neuroimage.2018.02.066. Epub 2018 Mar 6. Neuroimage. 2018. PMID: 29518568 Free PMC article.
-
A Bayesian Approach for Estimating Dynamic Functional Network Connectivity in fMRI Data.J Am Stat Assoc. 2018;113(521):134-151. doi: 10.1080/01621459.2017.1379404. Epub 2018 May 16. J Am Stat Assoc. 2018. PMID: 30853734 Free PMC article.
-
A multi-site resting state fMRI study on the amplitude of low frequency fluctuations in schizophrenia.Front Neurosci. 2013 Aug 8;7:137. doi: 10.3389/fnins.2013.00137. eCollection 2013. Front Neurosci. 2013. PMID: 23964193 Free PMC article.
References
-
- Allen EA, Erhardt EB, Damaraju E, Gruner W, Segall JM, Silva RF, Havlicek M, Rachakonda S, Fries J, Kalyanam R, Michael AM, Caprihan A, Turner JA, Eichele T, Adelsheim S, Bryan AD, Bustillo J, Clark VP, Feldstein Ewing SW, Filbey F, Ford CC, Hutchison K, Jung RE, Kiehl KA, Kodituwakku P, Komesu YM, Mayer AR, Pearlson GD, Phillips JP, Sadek JR, Stevens M, Teuscher U, Thoma RJ, Calhoun VD. A baseline for the multivariate comparison of restingstate networks. Front Syst Neurosci. 2011;5:2. - PMC - PubMed
-
- American, A.P.A. Diagnostic and Statistical Manual of Mental Disorders. 4th ed, Text Revision. Washington, DC: American Psychiatric Association; 2000.
-
- Auer DP. Spontaneous low-frequency blood oxygenation level-dependent fluctuations and functional connectivity analysis of the 'resting' brain. Magn Reson Imaging. 2008;26(7):1055–1064. - PubMed
Publication types
MeSH terms
Substances
Grants and funding
LinkOut - more resources
Full Text Sources
Other Literature Sources
Medical
Miscellaneous
