. 2012 Dec;140(6):653-69.
doi: 10.1085/jgp.201210847.

Probing the structural basis for differential KCNQ1 modulation by KCNE1 and KCNE2

Affiliations

Probing the structural basis for differential KCNQ1 modulation by KCNE1 and KCNE2

Yuhong Wang et al. J Gen Physiol. 2012 Dec.

Abstract

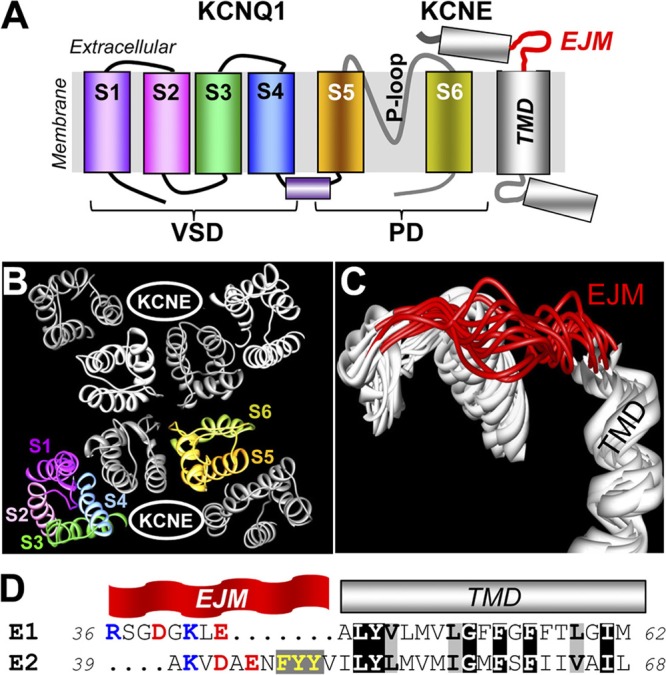
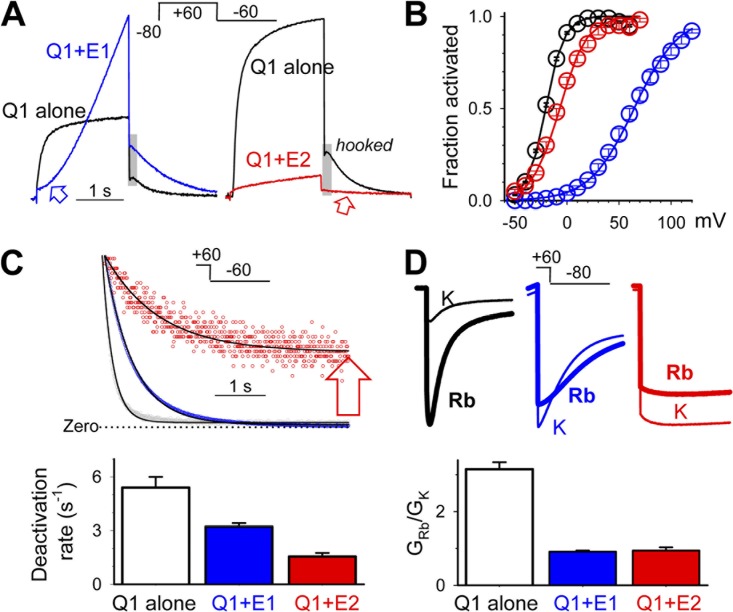
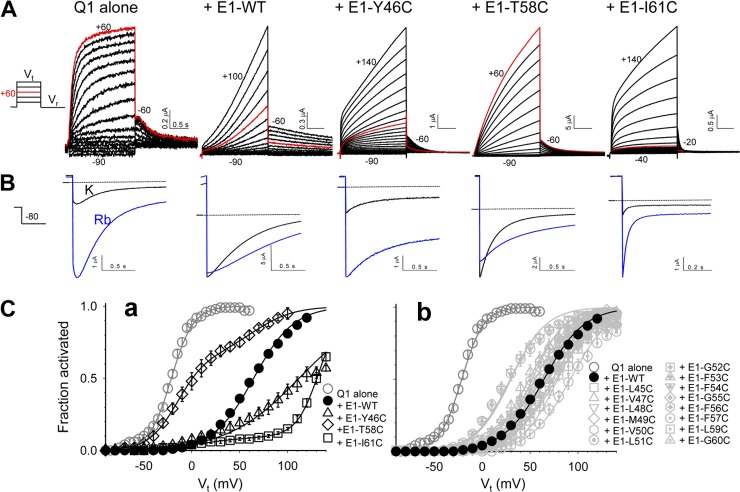
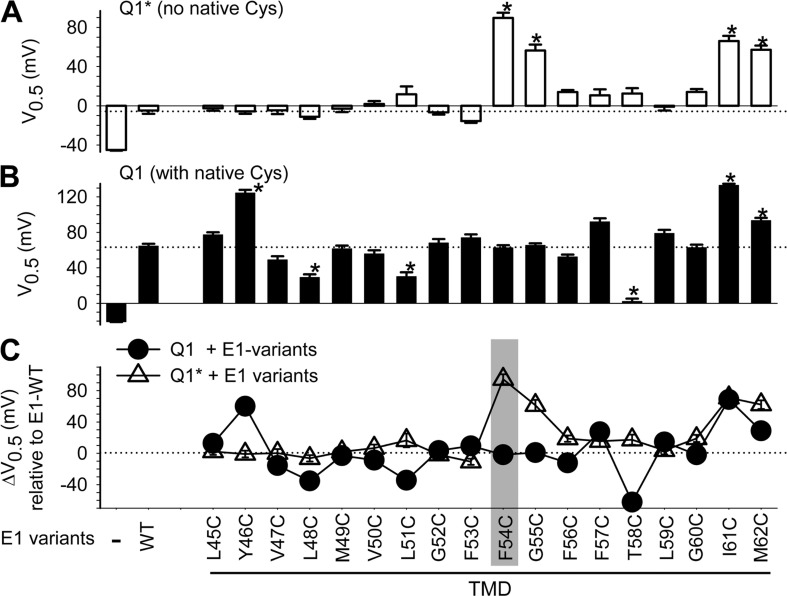
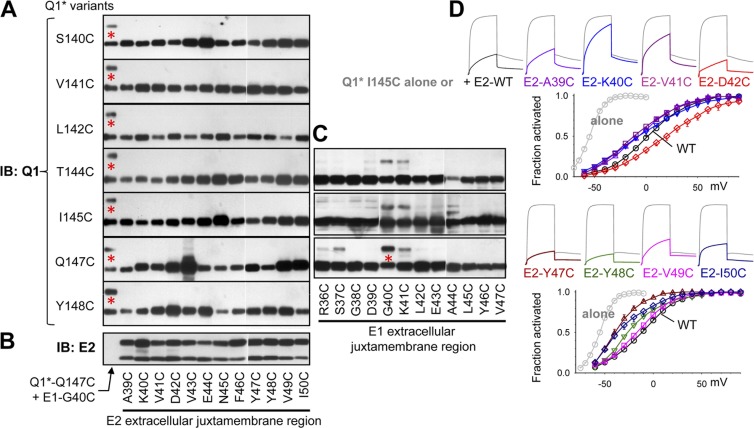
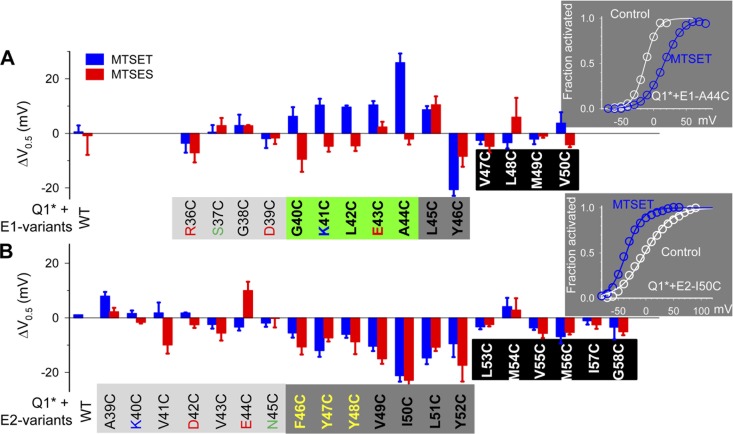
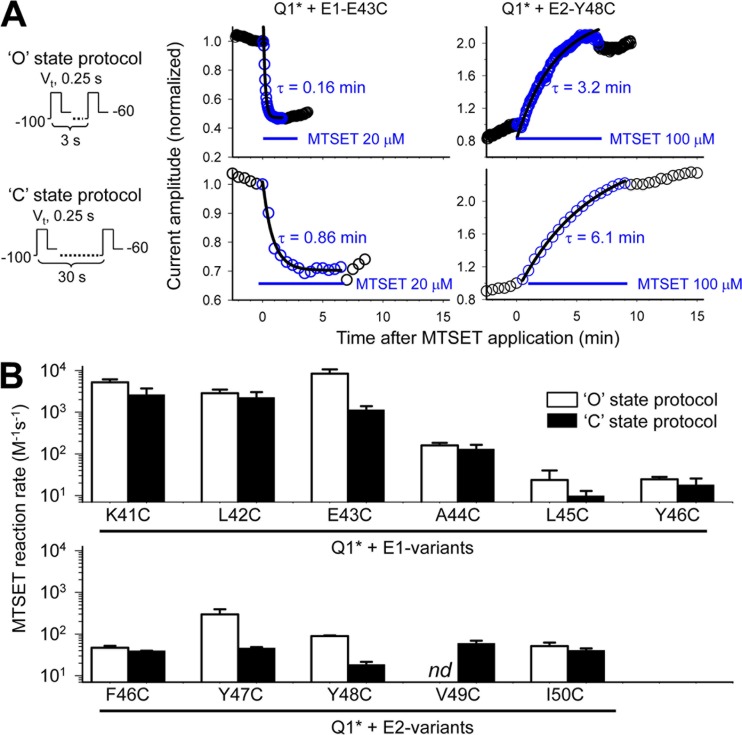
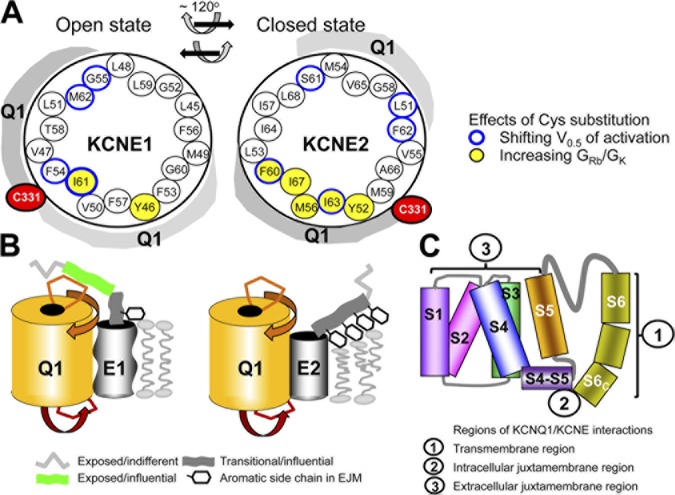
KCNE1 associates with KCNQ1 to increase its current amplitude and slow the activation gating process, creating the slow delayed rectifier channel that functions as a "repolarization reserve" in human heart. The transmembrane domain (TMD) of KCNE1 plays a key role in modulating KCNQ1 pore conductance and gating kinetics, and the extracellular juxtamembrane (EJM) region plays a modulatory role by interacting with the extracellular surface of KCNQ1. KCNE2 is also expressed in human heart and can associate with KCNQ1 to suppress its current amplitude and slow the deactivation gating process. KCNE1 and KCNE2 share the transmembrane topology and a high degree of sequence homology in TMD and surrounding regions. The structural basis for their distinctly different effects on KCNQ1 is not clear. To address this question, we apply cysteine (Cys) scanning mutagenesis to TMDs and EJMs of KCNE1 and KCNE2. We analyze the patterns of functional perturbation to identify high impact positions, and probe disulfide formation between engineered Cys side chains on KCNE subunits and native Cys on KCNQ1. We also use methanethiosulfonate reagents to probe the relationship between EJMs of KCNE subunits and KCNQ1. Our data suggest that the TMDs of both KCNE subunits are at about the same location but interact differently with KCNQ1. In particular, the much closer contact of KCNE2 TMD with KCNQ1, relative to that of KCNE1, is expected to impact the allosteric modulation of KCNQ1 pore conductance and may explain their differential effects on the KCNQ1 current amplitude. KCNE1 and KCNE2 also differ in the relationship between their EJMs and KCNQ1. Although the EJM of KCNE1 makes intimate contacts with KCNQ1, there appears to be a crevice between KCNQ1 and KCNE2. This putative crevice may perturb the electrical field around the voltage-sensing domain of KCNQ1, contributing to the differential effects of KCNE2 versus KCNE1 on KCNQ1 gating kinetics.


Figures

Figure 1.
Figure 1.
Regions of interest in KCNE1 and KCNE2 (TMD and EJM region) in terms of KCNQ1 modulation. (A) Transmembrane topology of KCNQ1 and KCNE subunits. Each KCNQ1 subunit has six transmembrane segments (S1–S6) with a reentrant P-loop and is functionally divided into voltage-sensing domain (VSD) and pore domain (PD). Based on the KCNE1 NMR structure (Protein Data Bank accession no. 2K21) (Kang et al., 2008), KCNE1 contains three major helical regions connected by flexible linkers. The TMD helix and EJM linker are highlighted. (B) Top view of KCNQ1 homology model (based on Kv1.2_Kv2.1 crystal structure; Protein Data Bank accession no. 2R9R; Long et al., 2007) shown as Cα-atom ribbons. One of the four KCNQ1 subunits is shown in rainbow colors, marking S1 to S6. The other three are shown as white, light gray, and dark gray ribbons. Two “KCNE-binding clefts” in diagonal spaces between KCNQ1 subunits are noted. (C) Ensemble of 10 KCNE1 NMR structures, with EJM and TMD marked. (D) Amino acid sequence alignment between KCNE1 and KCNE2 (“E1” and “E2”) in the regions of interest. Identical and similar residues in TMD are highlighted by black and gray shading, respectively. Positively and negatively charged residues in EJM are highlighted in blue and red. The three consecutive aromatic side chains in E2 EJM are highlighted in yellow.
Figure 2.
Figure 2.
Comparison between KCNE1 and KCNE2 in terms of their modulation of KCNQ1 gating kinetics and pore conductance. In all panels, data for “Q1 alone,” “Q1+E1,” and “Q1+E2” are color-coded black, blue, and red. (A) Superimposed current traces from oocytes expressing Q1 alone, Q1+E1, and Q1+E2. (Inset) Voltage-clamp protocol. Blue arrow points to the marked sigmoidal delay in Q1+E1 activation. Red arrow points to the slowing in Q1+E2 deactivation, relative to that of Q1 alone. Gray shading highlights the “hooked phase” of tail current seen in Q1 alone but not in Q1+E1 or Q1+E2. (B) 2-s isochronal activation curves of Q1 alone, Q1+E1, and Q1+E2. Tail currents (Itail) elicited by voltage-clamp protocols similar to that diagrammed in A with different test pulse voltages (Vt) are measured. For each oocyte, the relationship between Itail and Vt is fit with a simple Boltzmann function, Itail = Imax/(1 + exp[(V0.5 − Vt)F/(zgRT)]), to estimate the maximal Itail (Imax), half-maximum activation voltage (V0.5), and equivalent gating charge (zg); F, R, and T are Faraday constant, gas constant, and absolute temperature in °K. Itail is normalized by Imax to estimate “fraction activated,” and the mean values with SE bars are plotted against Vt. (C) Comparing rates of deactivation at −60 mV. (Top) Superimposed tail currents (shown as dots) of Q1 alone, Q1+E1, and Q1+E2, with peak amplitudes matched and zero current level marked. The superimposed curves are best-fit single-exponential functions: Itail,t = Itail,peak*exp(−t/τ) + Itail,ss, where Itail,t, Itail,peak, and Itail,ss are tail current amplitude at time “t,” initial peak, and steady-state (nondeactivating) component, and “τ” is time constant of deactivation. Red arrow points to a prominent nondeactivating component of Q1+E2. (Bottom) Summary of rates of deactivation (1/τ). (D) Comparing ratios of Rb conductance to K conductance (GRb/GK) for Q1 alone, Q1+E1, and Q1+E2. (Top) Tail currents elicited by the protocol shown in the inset recorded in 98 mM [K] and then 98 mM [Rb]. Under these conditions, the inward tail currents are carried by extracellular K+ and Rb+ ions, respectively. The K or Rb conductance is calculated by dividing the peak or plateau amplitude of K+- or Rb+-carried tail currents by the driving force (difference between –80 mV, at which the tail currents are measured, and the equilibrium potential for K+ or Rb+ ions measured in the same oocyte). (Bottom) Summary of GRb/GK values.
Figure 3.
Figure 3.
Examples of perturbing KCNE1 modulation of KCNQ1 gating function and pore conductance by Cys substitution in the TMD. (A) Original current traces of selected channels elicited by the voltage-clamp protocol diagrammed on the left. The beginning and end Vt values are marked close to each family of current traces. In all cases, the tail currents are recorded at −60 mV, except Q1/E1-I61C (−20 mV, to amplify the tail current amplitudes). Current traces elicited by Vt to +60 mV are shown in red to highlight the differences in the voltage range of channel activation. (B) Tail currents of the same channel types recorded in 98 mM [K]o and then 98 mM [Rb]o (black and blue traces, respectively). The tail currents are elicited by 2-s pulses to +60 mV and are recorded at −80 mV. Horizontal line denotes zero current level. (C) 2-s isochronal activation curves of Q1 alone, with E1-WT and with Cys-substituted E1 variants (in the TMD region). (a) E1-Y46C, E1-T58C, and E1-I61C show markedly shifted activation curves relative to E1-WT. (b) The other Cys-substituted mutants induce much less, or no, V0.5 shift relative to E1-WT.
Figure 4.
Figure 4.
Pattern of V0.5 perturbation by Cys substitution in KCNE1 TMD when coexpressed with KCNQ1* (A) or KCNQ1 (B), and the difference between these two patterns (C). Shown are V0.5 values determined from 2-s isochronal activation curves as described for Fig. 2 B, for KCNQ1* or KCNQ1, expressed alone or with KCNE1 variants listed along the abscissa. Dotted lines denote the V0.5 values for Q1*/E1-WT and Q1/E1-WT. (C) Comparison between KCNQ1 and KCNQ1* in terms of patterns of V0.5 perturbation by Cys substitution in KCNE1 TMD. ΔV0.5 = V0.5,MUT − V0.5,WT, where V0.5,MUT and V0.5,WT are V0.5 values of KCNE1 mutant and WT, respectively. Dotted line denotes zero ΔV0.5. Gray shading highlights position 54, which is the focus of search for interaction with native Cys on KCNQ1.
Figure 5.
Figure 5.
Probing interaction between Cys engineered into KCNE1 position 54 and KCNQ1 native C331. Four KCNQ1 constructs are used in experiments reported here: Q1 (the parent construct for the other three, with all eight native Cys present), Q1* (all native Cys replaced by Ala), Q1-C331A (C331 replaced by Ala, the other seven native Cys retained), and Q1*-331C (C331 retained, the other seven native Cys replaced by Ala). (A) Shift in V0.5 of activation induced by E1-WT or E1-F54C when coexpressed with Q1, Q1*, or Q1-C331A. (B) Shift in V0.5 of activation induced by a reducing agent, DTT (5 mM), in channel constructs listed along the abscissa. (C) An oxidizing agent, H2O2 (0.1%), induces a constitutive component in Q1*-331C/E1-F54C that is “channel activation” dependent but reversible upon H2O2 washout; the reversal is accelerated by DTT. (a and b) Average time courses of changes in the Q1*-331C/E1-F54C current amplitude measured at 5 ms upon depolarization to +60 mV (defined as the “constitutive component”) before, during, and after H2O2 exposure (duration marked by the gray shading). H2O2 washout is done without or with 5 mM DTT. Channels are activated by constant pulsing from Vh −100 to +60 mV for 2 s once every 30 s throughout. (c) Pulsing is discontinued while holding the membrane at −100 mV during H2O2 application for 10 min before resuming pulsing. Data are normalized by the H2O2-induced increase in constitutive component and fit with single-exponential functions to estimate the time constants (τs) of development of the constitutive component upon H2O2 wash-in and its reversal upon H2O2 washout. The data are summarized in (d). Data points during H2O2 wash-in (a and c) and H2O2 washout (b) are superimposed on curves calculated based on the single-exponential functions. (Insets in a and c) Representative current traces recorded during H2O2 exposure tested by the two protocols. Open arrows point to the time of current measurements. (D) Although Q1*-331C/E1-F54C develops a prominent constitutive component after pulsing in H2O2, neither Q1-C331A/E1-F54C nor Q1*-331C/E1-WT manifests such a constitutive component when tested under the same conditions. The ratios of constitutive component after pulsing in H2O2 to that under the control conditions are plotted against channel constructs. (n), number of oocytes tested. *, P < 0.05 for the specified pairs in A and C (d) or different from the other groups after multiple group comparison using one-way ANOVA followed by pairwise tests in B and D.
Figure 6.
Figure 6.
Pattern of V0.5 perturbation by Cys substitution in KCNE2 TMD when coexpressed with KCNQ1* (A) or KCNQ1 (B), and the difference between these two patterns (C). The format is the same as that of Fig. 4. nd, no V0.5 data for KCNQ1/KCNE2-L53C (currents too small) and KCNQ1/KCNE2-A66C (totally constitutive phenotype). Gray shading highlights position 59, which is the focus of search for disulfide formation with native Cys on KCNQ1.
Figure 7.
Figure 7.
Probing disulfide formation between Cys engineered into KCNE2 position 59 and KCNQ1 native C331. (A) Shift in V0.5 of activation induced by KCNE2-WT or KCNE2-M59C when coexpressed with KCNQ1, KCNQ1*, or KCNQ1-C331A. (B) Shift in V0.5 of activation induced by DTT in channel constructs listed along the abscissa. (n), number of oocytes tested. *, P < 0.05 for the specified pair in A or different from the other groups after multiple group comparison using one-way ANOVA followed by pairwise tests in B. (C) Composite KCNQ1 immunoblot images of whole cell lysates from COS-7 cells expressing cDNAs listed on top, without or with DTT treatment. Red asterisk, disulfide-linked KCNQ1*-Q147C/KCNE1-G40C band; red rectangle, putative disulfide-linked KCNQ1*-331C/KCNE2-M59C band. The size marker bands (in kD) are noted on the left, and the molecular species corresponding to the various bands are noted on the right: Q1, KCNQ1 monomer; Q1/E1, KCNQ1 monomer disulfide-linked to KCNE1; (Q1)2/(E2)x, KCNQ1 dimer disulfide linked to one or more KCNE2. White line indicates that intervening lane has been spliced out.
Figure 8.
Figure 8.
Pattern of GRb/GK perturbation by Cys substitution in KCNE1 and KCNE2 TMDs. (A) GRb/GK values (estimated as described for Fig. 2 D) for KCNQ1 and KCNQ1* (top and bottom, respectively) when expressed alone or with KCNE1 variants listed along the abscissa. Dotted lines denote the values for KCNE1-WT. (B) Same format as A for KCNE2 variants. Gray shading highlights positions where Cys substitution increases GRb/GK to values significantly higher than those of WT variants.
Figure 9.
Figure 9.
Probing disulfide formation between Cys engineered into the EJM region of KCNE2 and Cys engineered into KCNQ1* S1-S2 linker. (A) Nonreducing immunoblot images of KCNQ1* variants (listed on left) paired with Cys-substituted KCNE2 variants listed along the abscissa. The left-most lane in each panel is the positive control (KCNQ1*-Q147C/KCNE1-G40C; red asterisks denote the 80-kD disulfide-linked Q1/E1 band). Each panel is a composite of two immunoblots in the 50–100-kD range. The original immunoblot images of the whole range (from <50 to >250 kD) are shown in Fig. S4. (B) KCNE2 immunoblot to confirm protein expression of Cys-substituted KCNE2 variants. Multiple bands reflect core- and complex-glycosylated forms (Jiang et al., 2004). (C) Nonreducing immunoblot images of KCNQ1*-T144C, KCNQ1*-I145C, and KCNQ1*-Q147C paired with Cys-substituted KCNE1 variants, showing the prominent 80-kD disulfide-linked Q1/E1 bands in some of the KCNQ1*/KCNE1 pairs. White lines in A–C indicate that intervening lanes have been spliced out. (D) Current traces and 2-s isochronal activation curves of KCNQ1*-I145C expressed alone (gray current traces and activation curves of gray symbols), coexpressed with KCNE2-WT (black traces and black symbols), or Cys-substituted KCNE2 variants (each similarly color-coded for current traces and activation curve/symbols).
Figure 10.
Figure 10.
Patterns of V0.5 perturbation by MTSET and MTSES modification of Cys side chains engineered into the EJM and initial TMD regions of KCNE1 and KCNE2. In all experiments, KCNQ1* is used to avoid interference from native Cys, and oocytes are DTT treated before recording. (A and B) Summary of ΔV0.5 values plotted against KCNE1 or KCNE2 variants. ΔV0.5 = V0.5,MTS − V0.5,control, where V0.5,control and V0.5, MTS are V0.5 values before MTS application and after MTS washout. Shading along the abscissa signifies the position status: light gray, exposed/indifferent; green, exposed/influential; dark gray, transitional/influential; black, embedded/inaccessible. See Results for more details about how these are determined. (Insets) Examples of MTSET-induced shift in the voltage dependence of activation when applied to KCNQ1*/KCNE1-44C (positive V0.5 shift) or KCNQ1*/KCNE2-50C (negative V0.5 shift).
Figure 11.
Figure 11.
State dependence of MTSET reaction rates with Cys side chains engineered into selected positions in the EJM regions of KCNE1 and KCNE2. (A; left) Voltage-clamp protocols used to monitor the progression of MTSET modification that favors channels in the open or closed, “O” or “C,” states. Test pulses of 0.25-s duration to Vt (approximately V0.5 of activation for channel under investigation) are applied once every 3 or 30 s, which is equivalent to 8 or 0.8% of duty cycle favoring channel opening. (Middle and right) Time courses of changes in KCNQ1*/KCNE1-43C and KCNQ1*/KCNE2-48C current amplitudes before, during, and after MTSET exposure, monitored using the “O” (top) or “C” (bottom) state protocol. The duration of MTSET exposure and its concentration are marked. Data points during MTSET exposure are fit with a single-exponential function (superimposed curves), with time constant (τ) values marked. (B) Summary of MTSET reaction rates for Cys at KCNE1 positions 41–46 and KCNE2 positions 46–50, monitored using the “O” or “C” state protocol (open and closed histogram bars, respectively). The reaction rate is calculated as 1/(τ*[MTSET]). nd, no data for KCNQ1*/KCNE2-V49C (because the “O” state protocol produces a totally constitutive phenotype, precluding the quantification of MTSET effect on V0.5 of activation).
Figure 12.
Figure 12.
Summary of major findings and proposed structural basis for differential KCNQ1 modulation by KCNE1 and KCNE2. (A) Helical wheel plots of KCNE1 and KCNE2 TMDs, with equivalent positions (based on sequence alignment shown in Fig. 1 D) occupying the same locations. Blue rim highlights positions where, when coexpressed with KCNQ1*, Cys substitution significantly shifts the V0.5 value relatively to that by WT (Figs. 4 and 6). Yellow shading highlights positions where Cys substitution markedly increases the GRb/GK value above that of KCNQ1/KCNE-WT (Fig. 8). KCNQ1 domains around the KCNE TMDs are signified by gray shading. KCNQ1 native C331 is close to KCNE1 position 54 in the open state and to KCNE2 position 59 in the closed state (Figs. 5 and 7). Assuming that the C331 position is stationary, we propose a clockwise rotation of the KCNE transmembrane helix by ∼120° (viewed from the extracellular compartment) when the KCNQ1–KCNE complex transitions from the open to closed states, and a reverse rotation accompanying the closed-to-open–state transition. (B) Cartoon highlighting how KCNE1 and KCNE2 differ in their interactions with KCNQ1 based on the current and previous findings. We propose that the KCNE1 transmembrane helix is flexible (containing three Gly hinges, signified by a wavy cylinder) and makes loose contacts with KCNQ1, whereas the KCNE2 transmembrane helix is less flexible (only one Gly hinge, straight cylinder) and makes intimate contacts with KCNQ1. The EJM region of KCNE1 makes frequent contacts with the external surface of KCNQ1, but the corresponding region of KCNE2 does not (Fig. 9). We further propose an extracellular aqueous crevice between KCNQ1 and KCNE2 (Figs. 10 and 11), allowing MTSET to react with Cys-side chains here although slowly. The four closely spaced aromatic side chains in the KCNE2 EJM region may interact with phospholipid head groups and distort the lipid bilayer, creating the crevice between KCNQ1 and KCNE2. (C) Summary of three regions of KCNQ1/KCNE interactions: (1) The KCNE TMD mediates stable association with KCNQ1 (Tapper and George, 2000), directly affects S6 movements around hinges, and indirectly affects the selectivity filter conformation. (2) The cytoplasmic end of transmembrane helix and cytoplasmic proximal region of KCNE can affect the packing of the S4–S5 linker and the C terminus of S6, S6C (Lvov et al., 2010). (3) The EJM region of KCNE can affect the packing of S4 with S1, S2, and the pore domain (Nakajo and Kubo, 2007; Xu et al., 2008; Chung et al., 2009; Wang et al., 2011; Chan et al., 2012).

Similar articles

Cited by

References

    1. Abbott G.W., Sesti F., Splawski I., Buck M.E., Lehmann M.H., Timothy K.W., Keating M.T., Goldstein S.A.N. 1999. MiRP1 forms IKr potassium channels with HERG and is associated with cardiac arrhythmia. Cell. 97:175–18710.1016/S0092-8674(00)80728-X - DOI - PubMed
    1. Abraham R.L., Yang T., Blair M., Roden D.M., Darbar D. 2010. Augmented potassium current is a shared phenotype for two genetic defects associated with familial atrial fibrillation. J. Mol. Cell. Cardiol. 48:181–19010.1016/j.yjmcc.2009.07.020 - DOI - PMC - PubMed
    1. Bendahhou S., Marionneau C., Haurogne K., Larroque M.-M., Derand R., Szuts V., Escande D., Demolombe S., Barhanin J. 2005. In vitro molecular interactions and distribution of KCNE family with KCNQ1 in the human heart. Cardiovasc. Res. 67:529–53810.1016/j.cardiores.2005.02.014 - DOI - PubMed
    1. Campos F.V., Chanda B., Roux B., Bezanilla F. 2007. Two atomic constraints unambiguously position the S4 segment relative to S1 and S2 segments in the closed state of Shaker K channel. Proc. Natl. Acad. Sci. USA. 104:7904–790910.1073/pnas.0702638104 - DOI - PMC - PubMed
    1. Chan P.J., Osteen J.D., Xiong D., Bohnen M.S., Doshi D., Sampson K.J., Marx S.O., Karlin A., Kass R.S. 2012. Characterization of KCNQ1 atrial fibrillation mutations reveals distinct dependence on KCNE1. J. Gen. Physiol. 139:135–14410.1085/jgp.201110672 - DOI - PMC - PubMed

Publication types