. 2013 Mar;91(3):349-62.
doi: 10.1002/jnr.23166. Epub 2012 Nov 27.

Nucleus-localized 21.5-kDa myelin basic protein promotes oligodendrocyte proliferation and enhances neurite outgrowth in coculture, unlike the plasma membrane-associated 18.5-kDa isoform

Affiliations

Nucleus-localized 21.5-kDa myelin basic protein promotes oligodendrocyte proliferation and enhances neurite outgrowth in coculture, unlike the plasma membrane-associated 18.5-kDa isoform

Graham S T Smith et al. J Neurosci Res. 2013 Mar.

Abstract

The classic myelin basic protein (MBP) family of central nervous system (CNS) myelin arises from transcription start site 3 of the Golli (gene of oligodendrocyte lineage) complex and comprises splice isoforms ranging in nominal molecular mass from 14 kDa to (full-length) 21.5 kDa. We have determined here a number of distinct functional differences between the major 18.5-kDa and minor 21.5-kDa isoforms of classic MBP with respect to oligodendrocyte (OLG) proliferation. We have found that, in contrast to 18.5-kDa MBP, 21.5-kDa MBP increases proliferation of early developmental immortalized N19-OLGs by elevating the levels of phosphorylated ERK1/2 and Akt1 kinases and of ribosomal protein S6. Coculture of N2a neuronal cells with N19-OLGs transfected with the 21.5-kDa isoform (or conditioned medium from), but not the 18.5-kDa isoform, caused the N2a cells to have increased neurite outgrowth and process branching complexity. These roles were dependent on subcellular localization of 21.5-kDa MBP to the nucleus and on the exon II-encoded segment, suggesting that the nuclear localization of early minor isoforms of MBP may play a crucial role in regulating and/or initiating myelin and neuronal development in the mammalian CNS.


Figures

Fig. 1
Fig. 1
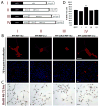
Classic MBP constructs, subcellular targeting, and proliferation assays. A: Schematic diagram of the RFP-tagged 18.5-kDa and 21.5-kDa MBP constructs, and their complementary reverse localization variants, that were used throughout this study to distinguish whether the nuclear localization of MBP, or the isoform specificity, was required for phenotypic gain of function. The inclusion of exon II in the 21.5-kDa isoform and the minimal 21-nt 3′-untranslated region (UTR) are also shown for completeness. B: Fluorescence micrographs of cultured N19-OLGs 3 days posttransfection expressing 18.5-kDa or 21.5-kDa MBP isoforms and their complementary reverse localization variants (red). The 2xNLS signal added as a linker between RFP and 18.5-kDa MBP traffics the protein to the nucleus, whereas the 2xNES added to 21.5-kDa MBP exports the protein out of the nucleus to the cytoplasm and plasma membrane. C: Cultured N19-OLGs expressing the four MBP constructs were processed for BrdU incorporation following a 24-hr BrdU pulse (BrdU administered between 48 hr and 72 hr posttransfection). The BrdU was detected using immunohistochemical diaminobenzidine staining. D: The percentage of total cells incorporating BrdU was determined by a blinded observer counting 10 random fields in three different experiments. A statistically significant increase in number of cells incorporating BrdU of 13% (**P = 0.05) was observed for RFP-MBP-21.5, and no increases in cell proliferation were seen in cultures transfected with either RFP-MBP-18.5 or RFP-2xNLS-MBP-18.5. Cell cultures transfected with RFP-2xNES-MBP-21.5 did not show any increases in cell proliferation, supporting the conclusion that the nuclear localization of 21.5-kDa MBP is required for cell proliferation. The 18.5-kDa MBP isoform, when localized to the nucleus, also did not increase the rate of cell proliferation, suggesting that this process requires the presence of the exon II-encoded segment. A color version of this figure can be found in the online version of this article. Scale bars = 20 μm in row 1; 50 μm in rows 2, 3. [Color figure can be viewed in the online issue, which is available at wileyonlinelibrary.com.]
Fig. 2
Fig. 2
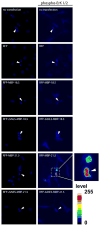
Immunofluorescence micrographs of N19-OLG cultures transfected with RFP-MBP constructs. All images were acquired using strict image acquisition settings that were the same for each micrograph. Staining of DNA in nuclei with DAPI (blue) is shown in the left panels. Nondividing cells have nuclear speckles, whereas dividing cells have more homogeneous, concentrated staining because of condensed DNA (arrowheads). Antiphospho-ERK1/2-Thr202/Tyr204 antibody staining is shown in the right panels in which the images were pseudocolored, with higher intensity pixels represented as warmer colors and lower intensity pixels as cooler colors, as indicated by the colorimetric gradient scale. Fluorescence immunostaining of cultures transfected with RFP-MBP-21.5 for pERK1/2-Thr202/Tyr204 revealed that both transfected and nontransfected N19-OLG cells in culture had 100–200 times elevated levels of phospho-ERK1/2 in the nuclei during mitosis compared with nontransfected cells or with cells transfected with RFP or other MBP variants. A color version of this figure can be found in the online version of this article. [Color figure can be viewed in the online issue, which is available at wileyonlinelibrary.com.]
Fig. 3
Fig. 3
A: Western blots from N19-OLG whole cell lysates following transfection with 18.5-kDa and 21.5-kDa MBP constructs and their complementary reverse localization variants (lysates from six separate transfections were pooled). Cells were transfected, and lysates were harvested 72 hr posttransfection, pooled, and probed for endogenous Akt, ERK1/2, pAkt-Ser473, and pERK1/2-Thr202/Tyr204. B: Densitometry measurements from the Western analyses in A were used to determine the ratio of the phosphorylated proteins to the total levels of Akt and ERK. Two equally loaded gels from the same lysates were used for these experiments to avoid complications arising from membrane stripping. A small increase in the ratio of pAkt-Ser473 in N19-OLG cell cultures transfected with RFP-MBP-21.5 compared with RFP-MBP-18.5, RFP-2x-NLS-MBP-18.5, and RFP-2xNES-MBP-21.5 was observed, whereas a considerable increase in the ratio of pERK1/2-Thr202/Tyr204 was detected in cell cultures transfected with RFP-MBP-21.5.
Fig. 4
Fig. 4
The N19-OLG cell cultures were probed for levels of total endogenous rpS6 ribosomal protein (A) and of rpS6 phosphorylated at Ser235/236 (B) as detected by the PathScan Phospho-S6 Ribosomal Protein (Ser235/236) Sandwich ELISA Antibody Pair (Cell Signaling; catalog No. 7205), following 72 hr posttransfection as suggested by the manufacturer. The ratio of phospho-rpS6 (denoted p-S6) to total rpS6 (denoted total S6) is shown in C. Lysates were assayed at a protein concentration of 0.45 mg/ml and were pooled from a total of 12 separate transfection experiments for each construct. The absorbance readings were measured at 450 nm. Compared with the RFP control and other variants, overexpression and nuclear localization of RFP-MBP-21.5 increases phosphorylation of the rpS6 ribosomal protein (p-S6).
Fig. 5
Fig. 5
A: The N19-OLG cells transfected with different MBP isoforms grown in coculture with N2a neuronal cells. Cell cultures were stained for endogenous tubulin (green), allowing the morphological distinction of tubulin-rich N2a neurons from N19-OLGs. Overexpression of RFP and RFP-MBPs (red) can be observed in N19-OLGs, and cell nuclei are labeled with DAPI (blue). The N19-OLGs were exposed to transfection for 48 hr prior to trypsinization. They were then transferred and plated at a density of 1.0 × 10⁶ cells/ml, together with N2a cells. The cocultures were grown for an additional 48 hr at 37°C prior to fixation, staining, and microscopy. The N2a neurons cocultured with N19-OLGs overexpressing the 21.5-kDa MBP isoform showed increases in neurite outgrowth and process branching complexity compared with those cocultured with N19-OLGs overexpressing 18.5-kDa MBP, RFP alone, or no transfection control. This result, for cells with possible contact between N2a cells and N19-OLGs (w/c), was also seen for N2a cells cocultured with N19-OLGs overexpressing 21.5-kDa MBP that were cultured in the same cell chamber, but in regions with no contact (n/c) between N2a cells and N19-OLGs (OLG-N2a). B: The N2a cells grown in monoculture and stained for neurofilament heavy chain (green), imaged 48 hr after a 50% supplementation of conditioned media from N19-OLG cultures overexpressing 21.5-kDa MBP, demonstrated increased branching complexity, but not a consistent change in process length, compared with the control. This result shows that this phenotype is attributable to a secreted factor from N19-OLG cultures overexpressing 21.5-kDa MBP and that N19-OLG-N2a cell–cell contact is not required. The N2a cells, at both high and low density, were affected similarly by conditioned media from N19-OLG cultures overexpressing 21.5-kDa MBP, indicating that N2a–N2a cell–cell contact is also not required. C: Quantification of branching complexity from cell cultures shown in B. The N2a cultures supplemented with conditioned media from N19-OLG cultures overexpressing 21.5-kDa MBP demonstrated a statistically significant threefold increase in secondary process branching (examples shown in micrographs, with branching indicated by arrowheads) compared with the control. Values represent mean ± standard deviation for four experiments with 80 cells counted per experiment. *P = 0.05 by Student’s t-test. Micrograph at left shows a cell that was categorized as having secondary (2°) branching, and that at right is an example of a cell that was characterized as having only primary (1°) branching. A color version of this figure can be found in the online version of this article. Scale bars = 100 μm. [Color figure can be viewed in the online issue, which is available at wileyonlinelibrary.com.]

Similar articles

Cited by

References

    1. Aggarwal S, Yurlova L, Simons M. Central nervous system myelin: structure, synthesis and assembly. Trends Cell Biol. 2011a;21:585–593. - PubMed
    1. Aggarwal S, Yurlova L, Snaidero N, Reetz C, Frey S, Zimmermann J, Pahler G, Janshoff A, Friedrichs J, Muller DJ, Goebel C, Simons M. A size barrier limits protein diffusion at the cell surface to generate lipid-rich myelin-membrane sheets. Dev Cell. 2011b;21:445–456. - PubMed
    1. Ainger K, Avossa D, Diana AS, Barry C, Barbarese E, Carson JH. Transport and localization elements in myelin basic protein mRNA. J Cell Biol. 1997;138:1077–1087. - PMC - PubMed
    1. Allinquant B, Staugaitis SM, D’Urso D, Colman DR. The ectopic expression of myelin basic protein isoforms in Shiverer oligodendrocytes: implications for myelinogenesis. J Cell Biol. 1991;113:393–403. - PMC - PubMed
    1. Baccarini M. Second nature: biological functions of the Raf-1 “kinase. FEBS Lett. 2005;579:3271–3277. - PubMed

Publication types