

Interventricular comparison of the energetics of contraction of trabeculae carneae isolated from the rat heart
- PMID: 23184511
- PMCID: PMC3577548
- DOI: 10.1113/jphysiol.2012.242719
Interventricular comparison of the energetics of contraction of trabeculae carneae isolated from the rat heart
Abstract
We compare the energetics of right ventricular and left ventricular trabeculae carneae isolated from rat hearts. Using our work-loop calorimeter, we subjected trabeculae to stress-length work (W), designed to mimic the pressure-volume work of the heart. Simultaneous measurement of heat production (Q) allowed calculation of the accompanying change of enthalpy (H = W + Q). From the mechanical measurements (i.e. stress and change of length), we calculated work, shortening velocity and power. In combination with heat measurements, we calculated activation heat (Q(A)), crossbridge heat (Q(xb)) and two measures of cardiac efficiency: 'mechanical efficiency' ((mech) = W/H) and 'crossbridge efficiency' ((xb) = W/(H - Q(A))). With respect to their left ventricular counterparts, right venticular trabeculae have higher peak shortening velocity, and higher peak mechanical efficiency, but with no difference of stress development, twitch duration, work performance, shortening power or crossbridge efficiency. That is, the 35% greater maximum mechanical efficiency of right venticular than left ventricular trabeculae (13.6 vs. 10.2%) is offset by the greater metabolic cost of activation (Q(A)) in the latter. When corrected for this difference, crossbridge efficiency does not differ between the ventricles.
Figures
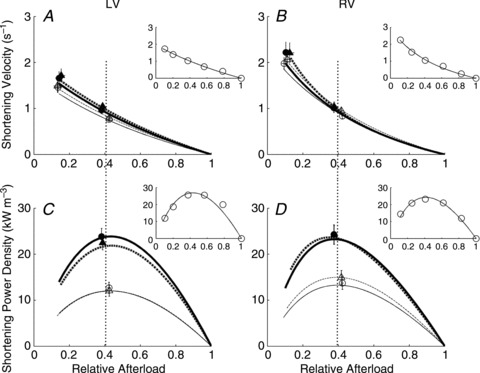
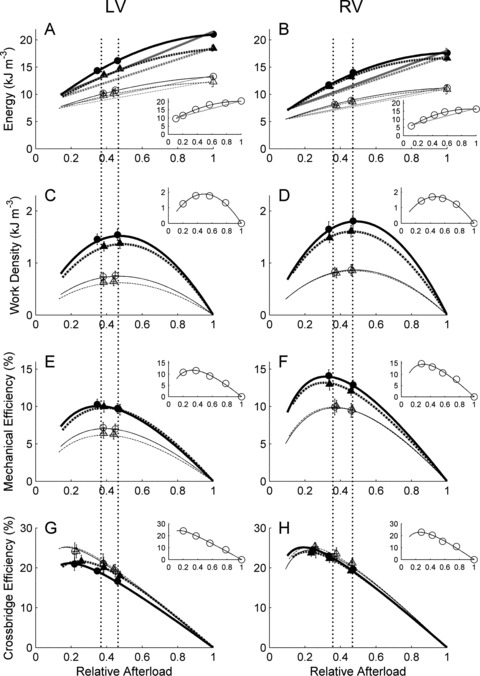
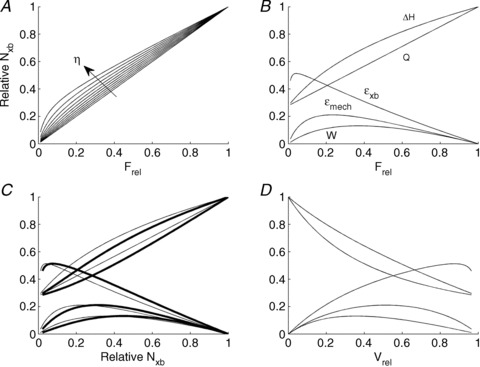
 ) as functions of relative afterload. The estimated peak values of
  (calculated from each of the individual 14 fitted curves) were averaged and superimposed. There was no significant difference of the average peak values of
  between RV and LV. At peak
  , no difference of Vmax between ventricles. Insets show data from representative trabeculae at 1 Hz and at Lo (RV trabecula: length 3.50 mm, diameter 325 μm; LV trabecula: length 2.00 mm, diameter 325 μm).
Similar articles
-
Do right-ventricular trabeculae gain energetic advantage from having a greater velocity of shortening?J Physiol. 2017 Oct 15;595(20):6477-6488. doi: 10.1113/JP274837. Epub 2017 Sep 24. J Physiol. 2017. PMID: 28857176 Free PMC article.
-
Streptozotocin-induced diabetes prolongs twitch duration without affecting the energetics of isolated ventricular trabeculae.Cardiovasc Diabetol. 2014 Apr 15;13:79. doi: 10.1186/1475-2840-13-79. Cardiovasc Diabetol. 2014. PMID: 24731754 Free PMC article.
-
Cardiac muscle contracts more efficiently at lower contraction frequencies.Exp Physiol. 2025 Apr;110(4):561-573. doi: 10.1113/EP092367. Epub 2025 Jan 29. Exp Physiol. 2025. PMID: 39888146 Free PMC article.
-
Relating components of pressure-volume area in Suga's formulation of cardiac energetics to components of the stress-time integral.J Appl Physiol (1985). 2012 Oct;113(7):988-95. doi: 10.1152/japplphysiol.00438.2012. Epub 2012 Jul 26. J Appl Physiol (1985). 2012. PMID: 22837173 Free PMC article. Review.
-
Left ventricular mechanoenergetics in small animals.Jpn J Physiol. 2004 Jun;54(3):175-207. doi: 10.2170/jjphysiol.54.175. Jpn J Physiol. 2004. PMID: 15541198 Review.
Cited by
-
Comparison of Biomechanical Properties and Microstructure of Trabeculae Carneae, Papillary Muscles, and Myocardium in the Human Heart.J Biomech Eng. 2019 Feb 1;141(2):0210071-02100710. doi: 10.1115/1.4041966. J Biomech Eng. 2019. PMID: 30418486 Free PMC article.
-
The afterload-dependent peak efficiency of the isolated working rat heart is unaffected by streptozotocin-induced diabetes.Cardiovasc Diabetol. 2014 Jan 5;13:4. doi: 10.1186/1475-2840-13-4. Cardiovasc Diabetol. 2014. PMID: 24387738 Free PMC article.
-
Experimental and modelling evidence of shortening heat in cardiac muscle.J Physiol. 2017 Oct 1;595(19):6313-6326. doi: 10.1113/JP274680. Epub 2017 Aug 22. J Physiol. 2017. PMID: 28771742 Free PMC article.
-
Dietary pre-exposure of rats to fish oil does not enhance myocardial efficiency of isolated working hearts or their left ventricular trabeculae.J Physiol. 2014 Apr 15;592(8):1795-808. doi: 10.1113/jphysiol.2013.269977. Epub 2014 Feb 17. J Physiol. 2014. PMID: 24535444 Free PMC article.
-
Sex differences in cardiac energetics in the rat ventricular muscle.Sci Rep. 2024 Dec 28;14(1):31242. doi: 10.1038/s41598-024-82604-3. Sci Rep. 2024. PMID: 39732777 Free PMC article.
References
-
- Afzal N, Dhalla NS. Differential changes in left and right ventricular SR calcium transport in congestive heart failure. Am J Physiol Heart Circ Physiol. 1992;262:H868–H874. - PubMed
-
- Asanoi H, Sasayama S, Kameyama T. Ventriculoarterial coupling in normal and failing heart in humans [published erratum appears in Circ Res 1990 Apr;66(4):1170] Circ Res. 1989;65:483–493. - PubMed
-
- Barclay CJ. A weakly coupled version of the Huxley crossbridge model can simulate energetics of amphibian and mammalian skeletal muscle. J Muscle Res Cell Motil. 1999;20:163–176. - PubMed
Publication types
MeSH terms
LinkOut - more resources
Full Text Sources
Other Literature Sources
Miscellaneous