Review
. 2013 Feb 15;591(4):787-97.
doi: 10.1113/jphysiol.2012.239590. Epub 2012 Nov 26.

Synchronization and desynchronization in epilepsy: controversies and hypotheses

Affiliations
Review

Synchronization and desynchronization in epilepsy: controversies and hypotheses

Premysl Jiruska et al. J Physiol. .

Abstract

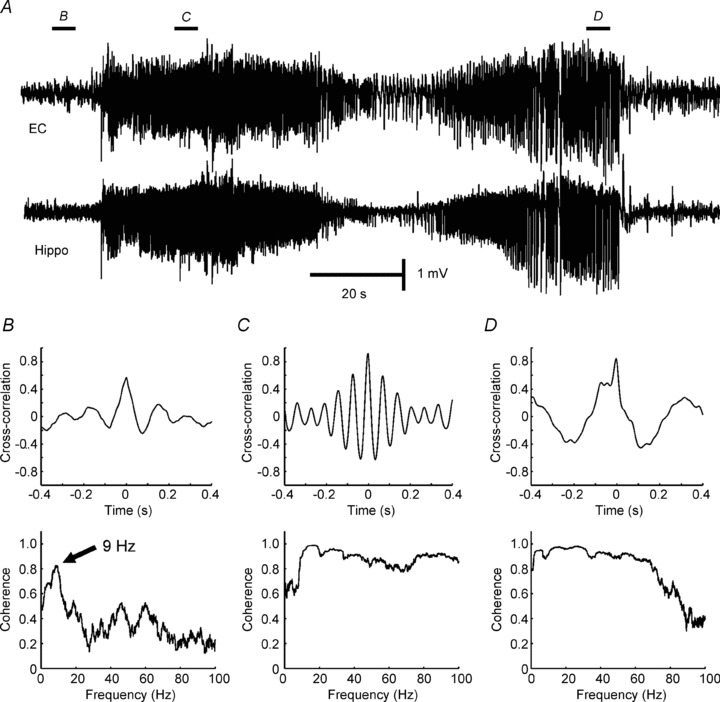
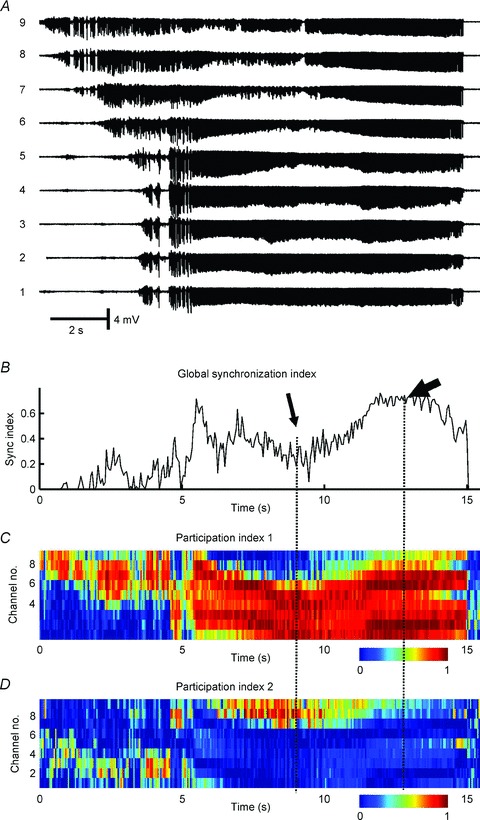
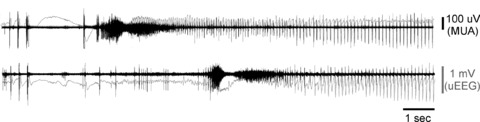
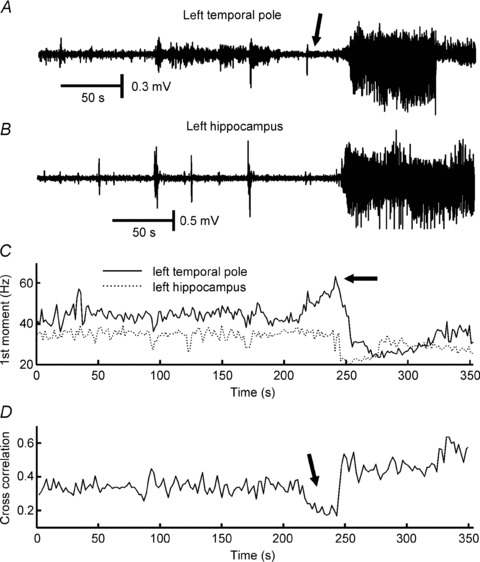
Epilepsy has been historically seen as a functional brain disorder associated with excessive synchronization of large neuronal populations leading to a hypersynchronous state. Recent evidence showed that epileptiform phenomena, particularly seizures, result from complex interactions between neuronal networks characterized by heterogeneity of neuronal firing and dynamical evolution of synchronization. Desynchronization is often observed preceding seizures or during their early stages; in contrast, high levels of synchronization observed towards the end of seizures may facilitate termination. In this review we discuss cellular and network mechanisms responsible for such complex changes in synchronization. Recent work has identified cell-type-specific inhibitory and excitatory interactions, the dichotomy between neuronal firing and the non-local measurement of local field potentials distant to that firing, and the reflection of the neuronal dark matter problem in non-firing neurons active in seizures. These recent advances have challenged long-established views and are leading to a more rigorous and realistic understanding of the pathophysiology of epilepsy.


Figures

Figure 1
Figure 1. Application of linear correlation and coherence to measure synchronization
A, synchronization between the hippocampus (Hippo) and entorhinal cortex (EC) was examined before and during seizure in a tetanus toxin model of temporal lobe epilepsy (Jiruska et al. unpublished results). B, correlation of 0.5 was observed between signals from hippocampus and entorhinal cortex recorded before onset of the seizure. Coherence, often interpreted as a correlation at each frequency, shows an obvious peak in coherence at frequency 9 Hz. C, cross-correlation and coherence during early and final parts of seizure (D) (Jiruska P & Jefferys JGR; unpublished results).
Figure 2
Figure 2. Synchronization profile of seizure activity in the low-calcium model in hippocampal slices in vitro
A, signals recorded from CA1 area with nine microelectrodes separated by ∼300 μm. B, wavelet phase synchronization was used to calculate the temporal profile of a global synchronization index and shows a progressive increase in synchronization which reaches maximal values towards the end of the seizure. C, random matrix analysis was applied to determine the temporal profile of the first participation index. This index identifies the largest synchronization cluster and its components. Colours indicate how much each channel contributes to the cluster at each time. Cold colours indicate a low contribution while hot colours mean a high contribution. D, the second largest cluster of synchronization. The drop in global synchronization index (thin arrow) is due to the development of two independent clusters of synchrony. During the final part of the seizure, when synchronization reaches its maximal value, ictal activity is generated by a single large cluster of synchronous activity (thick arrow) to which nearly all channels contribute (Jiruska P & Jefferys JGR; unpublished results; random matrix analysis was described in detail in Li et al. 2007).
Figure 3
Figure 3. Early parts of a human seizure recording from two Utah array microelectrodes (3 mm apart)
The figure shows simultaneous multi-unit activity (MUA; 300 Hz–3 kHz, 500th order FIR bandpass filter, black traces) and ‘micro’ EEG (uEEG; <50 Hz low-pass filter, grey trace). The activity in the bottom channel joins the seizure several seconds after the top channel, and shows MUA during the penumbral, tonic and clonic phases of the seizure. Note that the two MUA recordings are highly synchronized during the clonic phase, but at no other time. The penumbral phase clearly demonstrates dissociation between MUA and EEG (Schevon CA, McKhann G, Goodman RR, Yuste R, Emerson RG, Trevelyan AJ unpublished results; for details see Schevon et al. 2012).
Figure 4
Figure 4. Desynchronization at the onset of a seizure recorded with intracranial electrodes in a patient with temporal lobe epilepsy
A, recording from the left temporal pole contact located at the seizure onset zone. Ictal onset is characterized by the presence of gamma and fast gamma activity (60–120 Hz; arrow). B, simultaneous recording from the left hippocampus. C, first spectral moment within the 2–200 Hz frequency band demonstrates a temporal dependence of the spectral content. The presence of a high-frequency onset is characterized by an increase in the first spectral moment (arrow). D, temporal evolution of cross-correlation between signals from temporal pole and hippocampus: the initial part of the seizure is characterized by decorrelation (desynchronization; arrow). Unpublished data (Jiruska P, Jefferys JGR, Marusic P) from case reported by Jiruska et al. 2008.

Similar articles

Cited by

References

    1. Babb TL, Wilson CL, Isokawa-Akesson M. Firing patterns of human limbic neurons during stereoencephalography (SEEG) and clinical temporal lobe seizures. Electroencephalogr Clin Neurophysiol. 1987;66:467–482. - PubMed
    1. Bertram EH. Temporal lobe epilepsy: where do the seizures really begin. Epilepsy Behav. 2009;14:32–37. - PMC - PubMed
    1. Bikson M, Fox JE, Jefferys JGR. Neuronal aggregate formation underlies spatiotemporal dynamics of nonsynaptic seizure initiation. J Neurophysiol. 2003;89:2330–2333. - PubMed
    1. Bishop G. Cyclic changes in excitability of the optic pathway of the rabbit. American Journal of Physiology-Legacy. 1932;103:213–224.
    1. Bower MR, Stead M, Meyer FB, Marsh WR, Worrell GA. Spatiotemporal neuronal correlates of seizure generation in focal epilepsy. Epilepsia. 2012;53:807–816. - PMC - PubMed

Publication types