. 2013 Feb;37(2):142-51.
doi: 10.1002/gepi.21699. Epub 2012 Nov 26.

Detecting rare variant effects using extreme phenotype sampling in sequencing association studies

Affiliations

Detecting rare variant effects using extreme phenotype sampling in sequencing association studies

Ian J Barnett et al. Genet Epidemiol. 2013 Feb.

Abstract

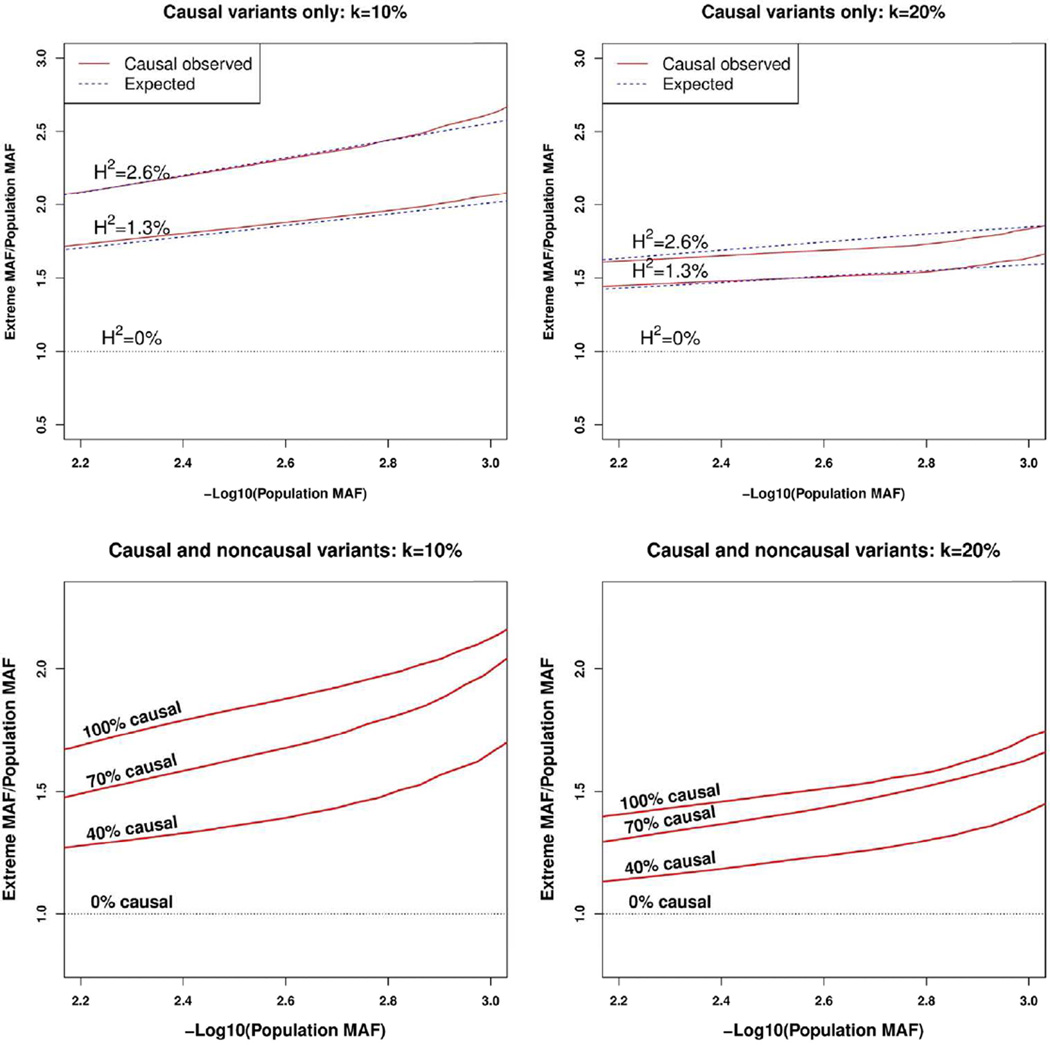
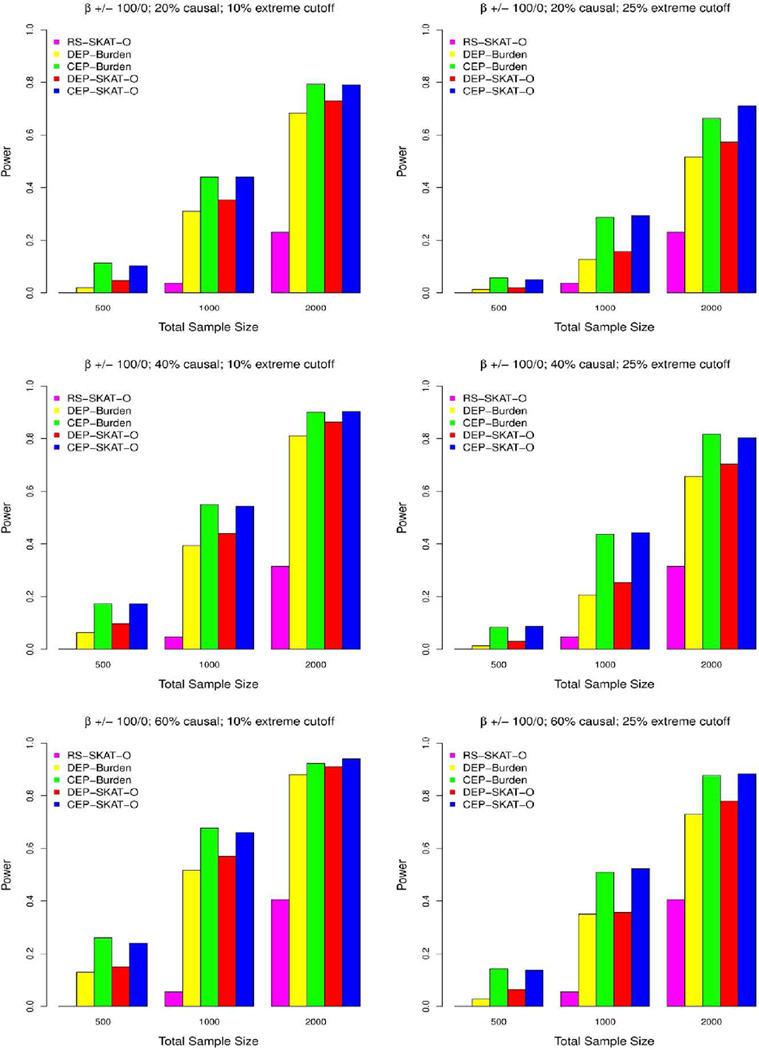
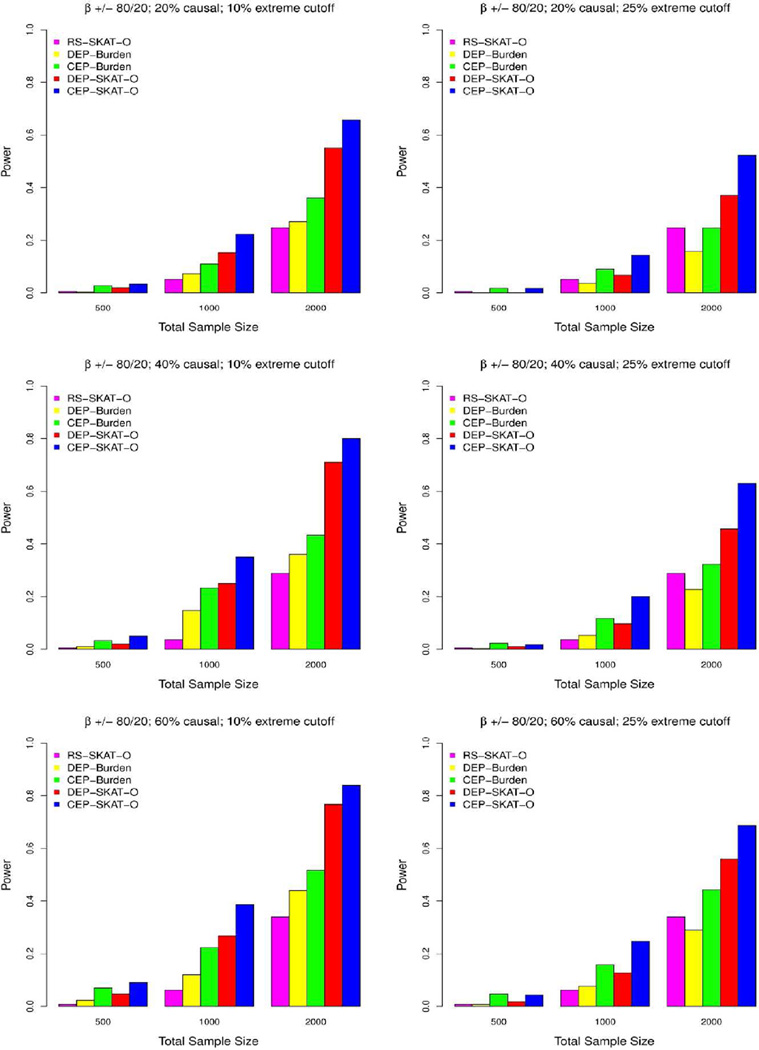
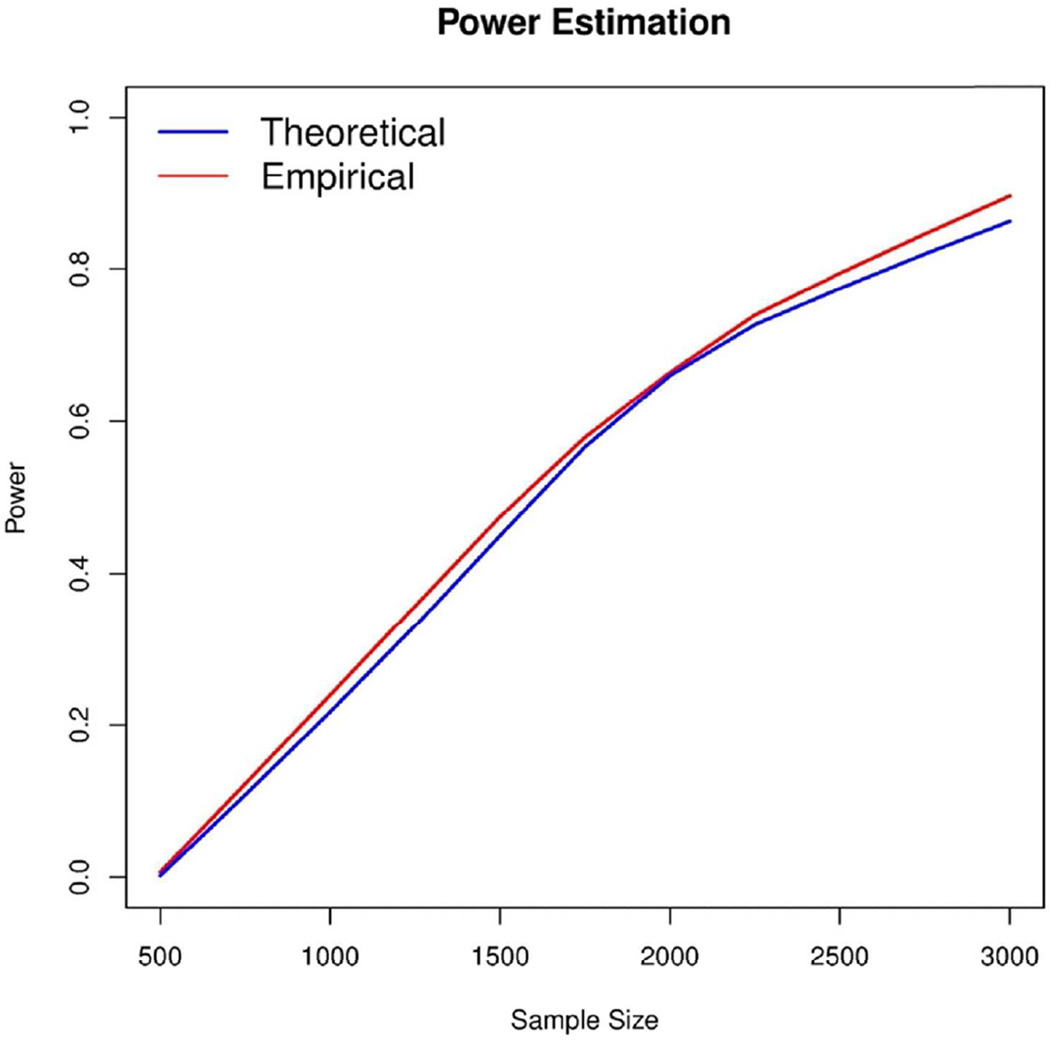
In the increasing number of sequencing studies aimed at identifying rare variants associated with complex traits, the power of the test can be improved by guided sampling procedures. We confirm both analytically and numerically that sampling individuals with extreme phenotypes can enrich the presence of causal rare variants and can therefore lead to an increase in power compared to random sampling. Although application of traditional rare variant association tests to these extreme phenotype samples requires dichotomizing the continuous phenotypes before analysis, the dichotomization procedure can decrease the power by reducing the information in the phenotypes. To avoid this, we propose a novel statistical method based on the optimal Sequence Kernel Association Test that allows us to test for rare variant effects using continuous phenotypes in the analysis of extreme phenotype samples. The increase in power of this method is demonstrated through simulation of a wide range of scenarios as well as in the triglyceride data of the Dallas Heart Study.


Figures

Figure 1
Figure 1. Enrichment of causal rare variants in phenotypic extremes
Estimated folds increase of the observed MAFs of causal variants in phenotypic extremes over population MAFs. The red lines represent the smoothed observed fold increases. The dotted lines represent the theoretical fold increase. For each causal variant, population MAF was computed using the full simulated population while extreme phenotype MAF was computed after sampling the tails. See Supplemental Materials for derivation of theoretical expected MAF for extreme phenotypes. The top two figures consider the case where all variants are causal by sampling k=10% and 20% high/low extremes. For each case, three situations were considered by heritability of causal variants: H2=2.6%, 1.3%, and 0% (no causal variant). Higher heritability gives more enrichment of rare variants. The bottom two figures consider the case where different fractions of variants in a region are causal (100%, 70%, 40% and 0%) by sampling k=10% and 20% high/low extremes. Presence of non-causal variants in a region lower the degree of enrichment of rare variants.
Figure 2
Figure 2. Power comparisons when all causal variants have the same effect direction
Simulated power comparisons between four rare variants association tests with all causal variants having a positive effect on phenotype. The five tests are random sample optimal SKAT (RS-SKAT-O), dichotomized extreme phenotype burden test (DEP-Burden), continuous extreme phenotype burden test (CEP-Burden), dichotomized extreme phenotype optimal SKAT (DEP-SKAT-O), and continuous extreme phenotype optimal SKAT (CEP-SKAT-O). The left panel considers the situation where 10% high/low extremes are sampled with the three rows corresponding to 20% (0.6% heritability), 40% (1.2% heritability) and 60% (1.8% heritability) variants in a 3kb region being causal. Three total sample sizes are considered: n=500, 1000, 2000. The right panel considers the situation where 25% high/low extremes are sampled. Exonic regions are simulated with effect sizes for each causal variant equal to β=−0.2log10MAF. Power is estimated by the proportion of tests that detect an association at the α=10−6 level.
Figure 3
Figure 3. Power comparisons when causal variants have opposite effect directions
Simulated power comparisons between four rare variants association tests with 80% of rare causal variants selected to have a positive effect on phenotype while the remaining 20% have a negative effect. The five tests are random sample SKAT (RS-SKAT-O), dichotomized extreme phenotype burden test (DEP-Burden), continuous extreme phenotype burden test (CEP-Burden), dichotomized extreme phenotype optimal SKAT (DEP-SKAT-O), and continuous extreme phenotype optimal SKAT (CEP-SKAT-O). The left panel considers the situation where 10% high/low extremes are sampled with the three rows corresponding to 20% (0.6% heritability), 40% (1.2% heritability) and 60% (1.8% heritability) variants in a 3kb region being causal. Three total sample sizes are considered: n=500, 1000, 2000. The right panel considers the situation where 25% high/low extremes are sampled. Exonic regions are simulated with effect sizes for each causal variant equal to |β|=−0.2log10MAF with the effect being negated 20% of the time. Power is estimated by the proportion of tests that detect an association at the α=10−6 level.
Figure 4
Figure 4. Comparison of theoretical and empirical powers
Estimated power of CEP-SKAT for testing 3kb regions with 20% of variants being causal with all effects in the same direction and the casual variants have effects to |β|=−0.2log10MAF. Theoretical power was calculated as described in section 5 of the Supplementary material, and empirical power was estimated by simulation using 300 replicates. No covariates were considered in either the theoretical or empirical power calculations. Furthermore empirical power was computed using CEP-SKAT without small sample adjustments.

Similar articles

Cited by

References

    1. Bansal V, Libiger O, Torkamani A, Schork NJ. Statistical analysis strategies for association studies involving rare variants. Nature Reviews Genetics. 2010;11(11):773–785. - PMC - PubMed
    1. Basu S, Pan W. Comparison of statistical tests for disease association with rare variants. Genetic Epidemiology. 2011 - PMC - PubMed
    1. Biesecker LG, Shianna KV, Mullikin JC. Exome sequencing: the expert view. Genome Biol. 2011;12(9):128. - PMC - PubMed
    1. Chen Z, Zheng G, Ghosh K, Li Z. Linkage disequilibrium mapping of quantitative-trait Loci by selective genotyping. Am J Hum Genet. 2005;77(4):661–669. - PMC - PubMed
    1. Cirulli ET, Goldstein DB. Uncovering the roles of rare variants in common disease through wholegenome sequencing. Nat Rev Genet. 2010;11(6):415–425. - PubMed

Publication types

LinkOut - more resources