

doi: 10.1002/9780471729259.mc01e05s27.
Using QIIME to analyze 16S rRNA gene sequences from microbial communities
Affiliations
- PMID: 23184592
- PMCID: PMC4477843
- DOI: 10.1002/9780471729259.mc01e05s27
Item in Clipboard
Using QIIME to analyze 16S rRNA gene sequences from microbial communities
Curr Protoc Microbiol.
2012 Nov.
Abstract
QIIME (canonically pronounced "chime") is a software application that performs microbial community analysis. It is an acronym for Quantitative Insights Into Microbial Ecology, and has been used to analyze and interpret nucleic acid sequence data from fungal, viral, bacterial, and archaeal communities. The following protocols describe how to install QIIME on a single computer and use it to analyze microbial 16S sequence data from nine distinct microbial communities.
© 2012 by John Wiley & Sons, Inc.
Figures
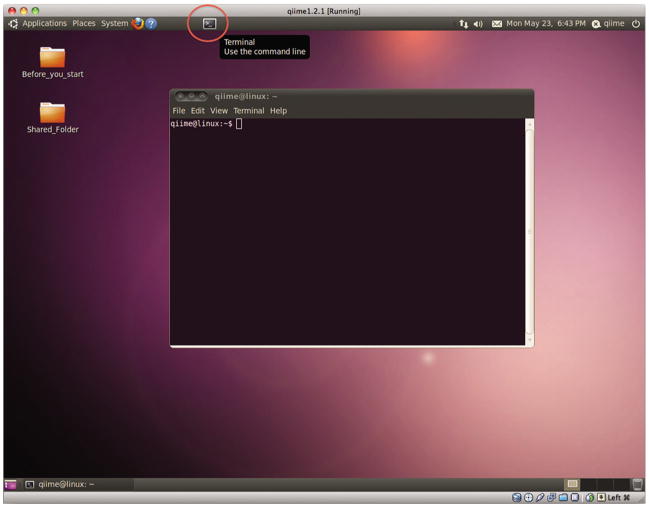
A screenshot of the QIIME VirtualBox, with the terminal icon indicated, and a terminal window open.
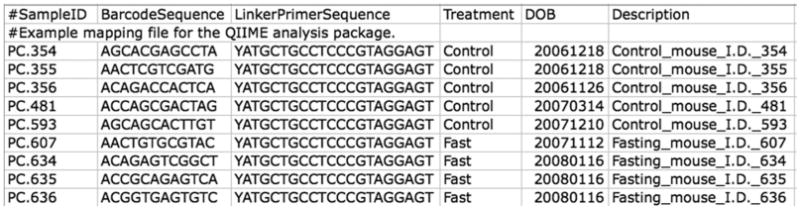
Contents of the mapping file (
Fasting_Map.txt ). Note that the SampleIDs contain only letters, numbers, and period characters.
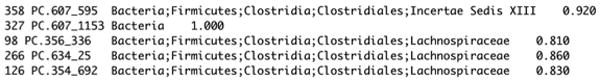
The first few lines of the taxonomy assignment file, showing on each line the OTU identifier, the representative sequence identifier, the taxonomy assigned to that sequence, and the confidence in that assignment.
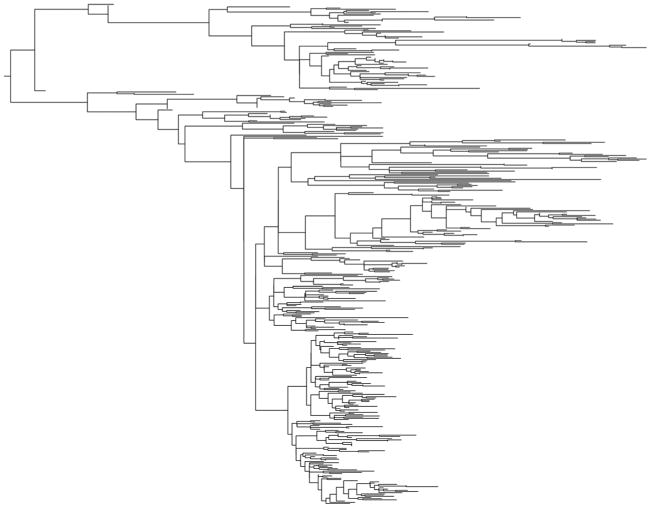
A visualization of the phylogenetic tree using FigTree. The tips are unlabeled here, but can be inspected interactively.
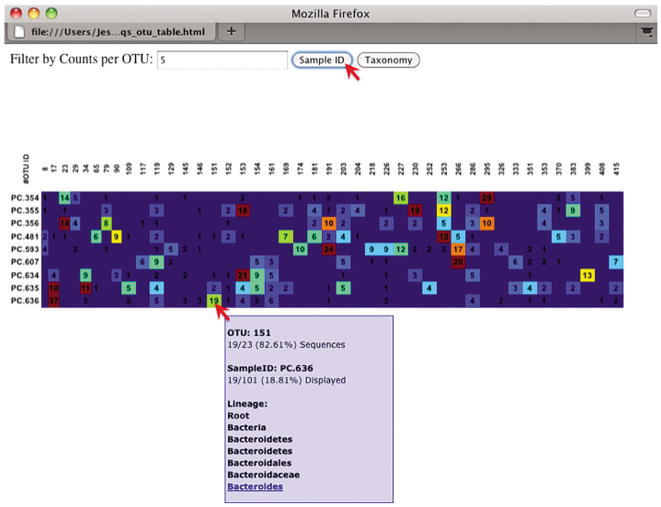
An OTU table heatmap, showing the relative abundance of each OTU within each microbial community.
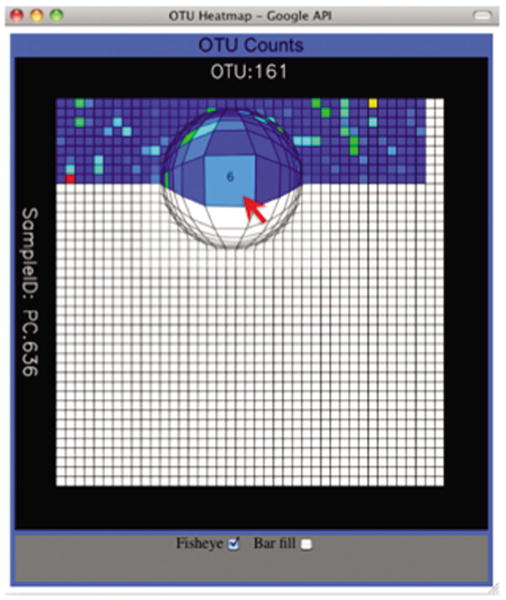
Magic-Table visualization of the OTU table heatmap.
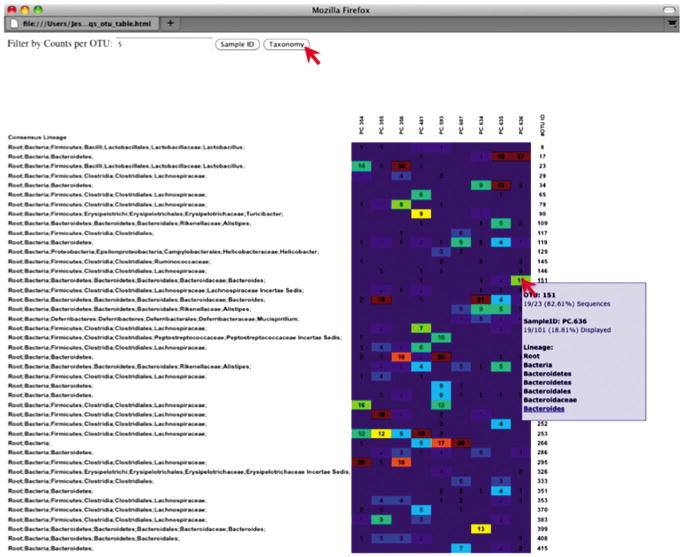
An OTU table heatmap showing taxonomy assignment for each OTU.
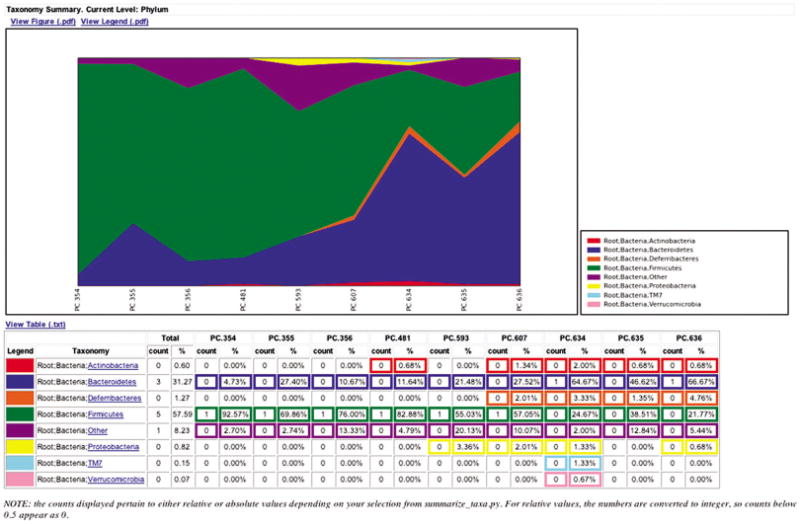
An area chart showing the relative abundance of each phylum within each microbial community.
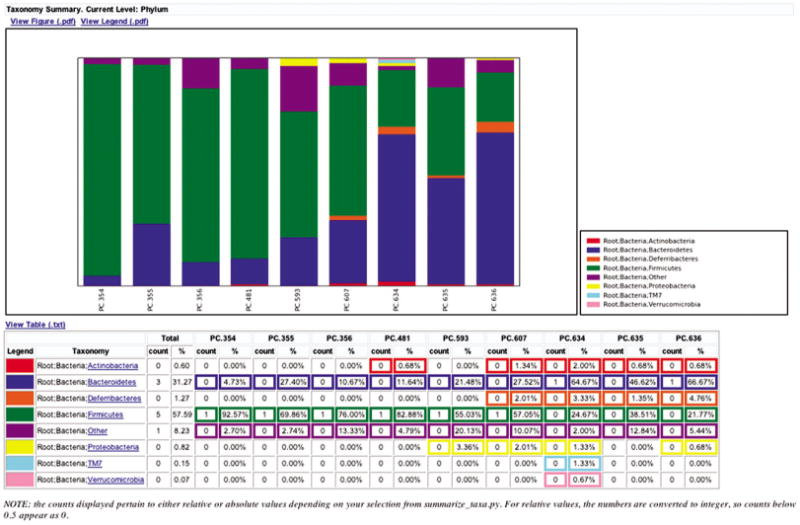
A bar chart of phylum level abundance within communities, similar to Figure 10.7.8.
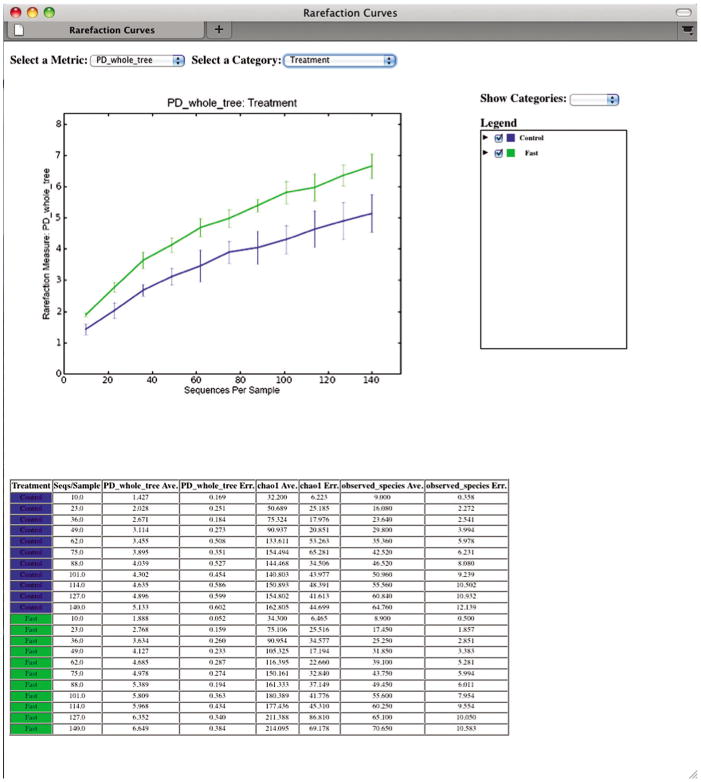
A Web browser window displaying rarefaction plots. The vertical axis displays the diversity of the community, while the horizontal axis displays the number of sequences considered in the diversity calculation. Each line on the figure represents the average of all microbial belonging to a group within a category: here the green line represents all fasted mouse communities, and the blue line represents the control communities.
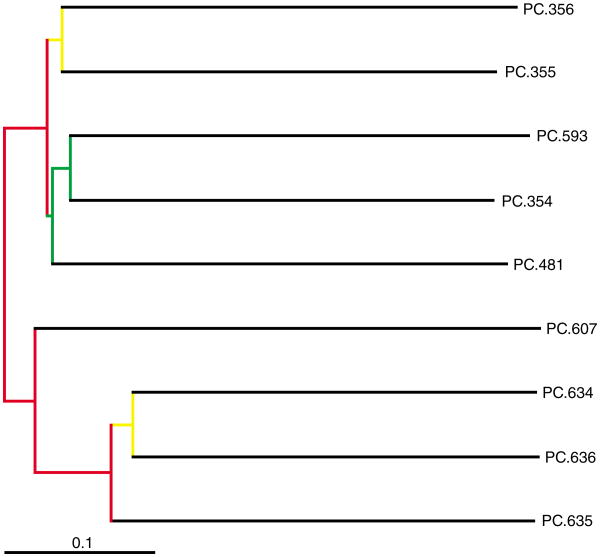
A visualization of bootstrap-supported hierarchical clustering of the 9 microbial communities under investigation. Note that the fasted mouse communities (
PC.6×× ) cluster together, and the result is supported by jackknife tests (red implies > 75% support).
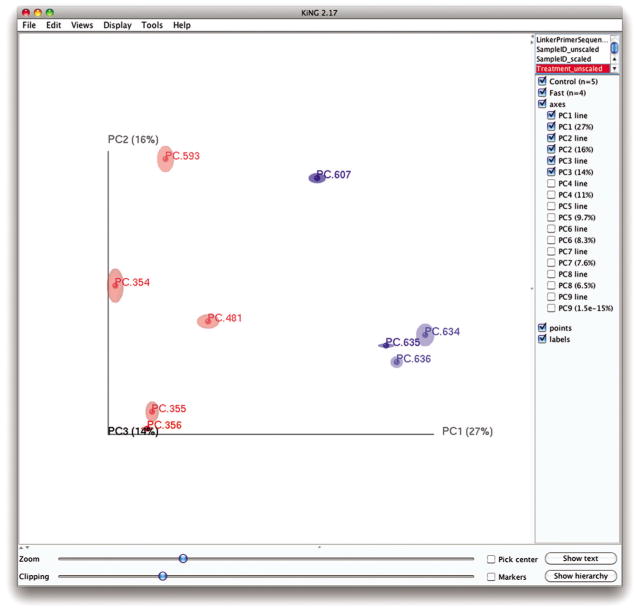
A Principal Coordinates plot of the 9 communities, showing jackknife-supported confidence ellipsoids. The first two principal axes are shown.
References
-
- Arumugam M, Raes J, Pelletier E, Le Paslier D, Yamada T, Mende DR, Fernandes GR, Tap J, Bruls T, Batto JM, Bertalan M, Borruel N, Casellas F, Fernandez L, Gautier L, Hansen T, Hattori M, Hayashi T, Kleerebezem M, Kurokawa K, Leclerc M, Levenez F, Manichanh C, Nielsen HB, Nielsen T, Pons N, Poulain J, Qin J, Sicheritz-Ponten T, Tims S, Torrents D, Ugarte E, Zoetendal EG, Wang J, Guarner F, Pedersen O, de Vos WM, Brunak S, Doré J, Antolín M, Artiguenave F, Blottiere HM, Almeida M, Brechot C, Cara C, Chervaux C, Cultrone A, Delorme C, Denariaz G, Dervyn R, Foerstner KU, Friss C, van de Guchte M, Guedon E, Haimet F, Huber W, van Hylckama-Vlieg J, Jamet A, Juste C, Kaci G, Knol J, Lakhdari O, Layec S, Le Roux K, Maguin E, Mérieux A, Melo Minardi R, M'rini C, Muller J, Oozeer R, Parkhill J, Renault P, Rescigno M, Sanchez N, Sunagawa S, Torrejon A, Turner K, Vandemeulebrouck G, Varela E, Winogradsky Y, Zeller G, Weissenbach J, Ehrlich SD, Bork P MetaHIT Consortium. Enterotypes of the human gut microbiome. Nature. 2011;474:666. - PMC - PubMed
Publication types
MeSH terms
Substances
Grants and funding
- HG4872/HG/NHGRI NIH HHS/United States
- T32 GM008759/GM/NIGMS NIH HHS/United States
- HHMI/Howard Hughes Medical Institute/United States
- U01 HG004866/HG/NHGRI NIH HHS/United States
- GM65103/GM/NIGMS NIH HHS/United States
- R01 HG004872/HG/NHGRI NIH HHS/United States
- GM8759/GM/NIGMS NIH HHS/United States
- HG4866/HG/NHGRI NIH HHS/United States
- LM9451/LM/NLM NIH HHS/United States
- DK83981/DK/NIDDK NIH HHS/United States
- UH2 DK083981/DK/NIDDK NIH HHS/United States
- P01 DK078669/DK/NIDDK NIH HHS/United States
- UH3 DK083981/DK/NIDDK NIH HHS/United States
- T15 LM009451/LM/NLM NIH HHS/United States
- DK78669/DK/NIDDK NIH HHS/United States
- T32 GM065103/GM/NIGMS NIH HHS/United States
LinkOut - more resources
Full Text Sources
Other Literature Sources
