

Evolutionary mode routinely varies among morphological traits within fossil species lineages
- PMID: 23184976
- PMCID: PMC3528549
- DOI: 10.1073/pnas.1209901109
Evolutionary mode routinely varies among morphological traits within fossil species lineages
Abstract
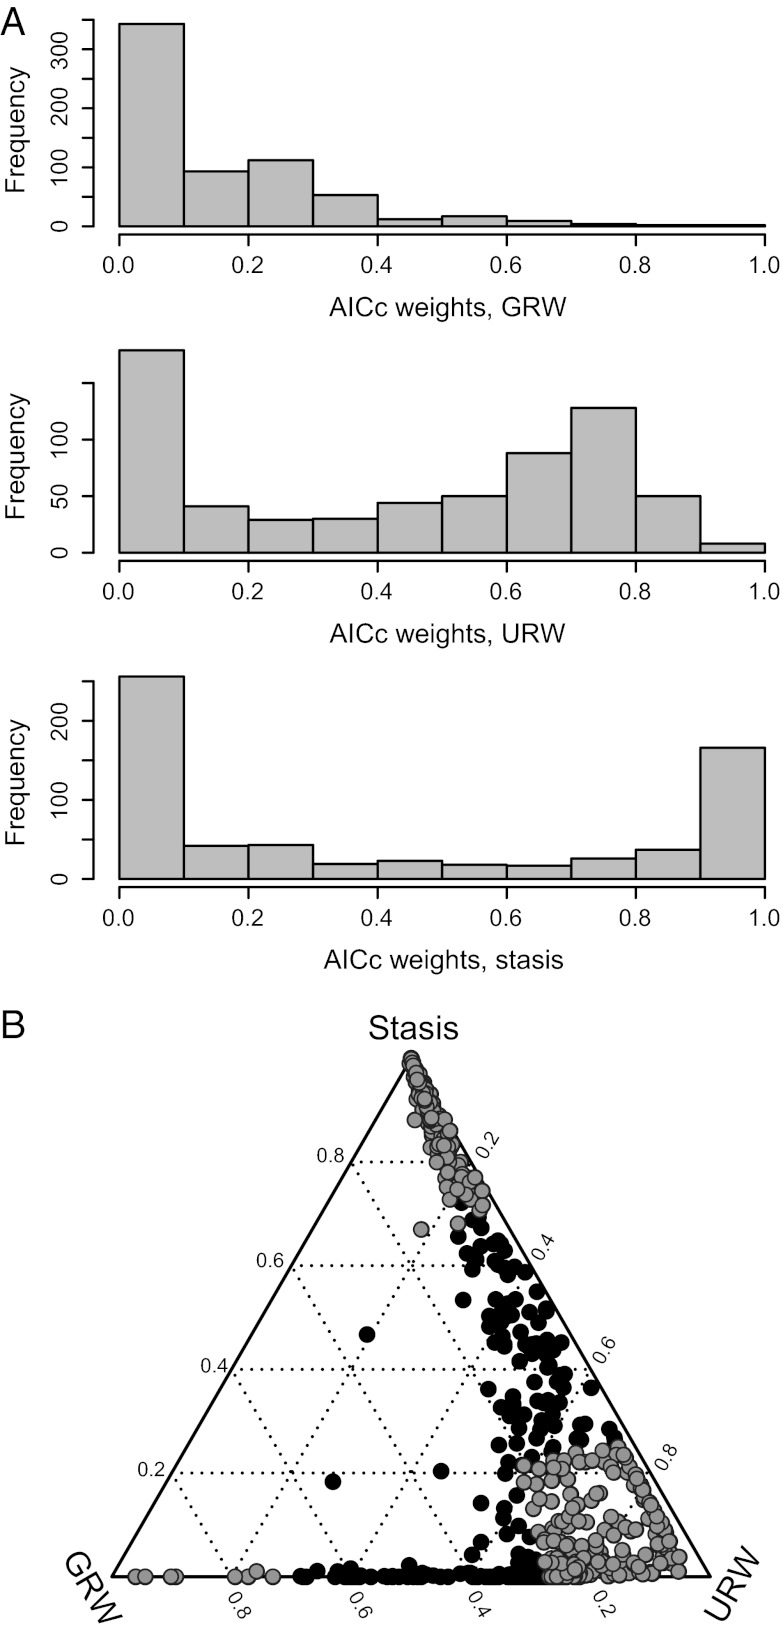
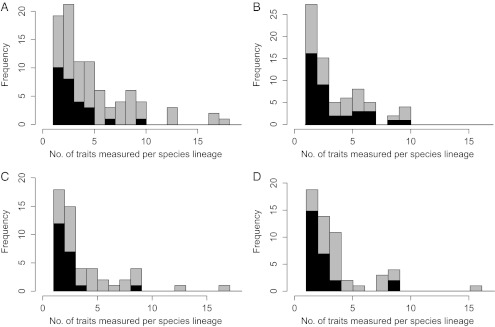
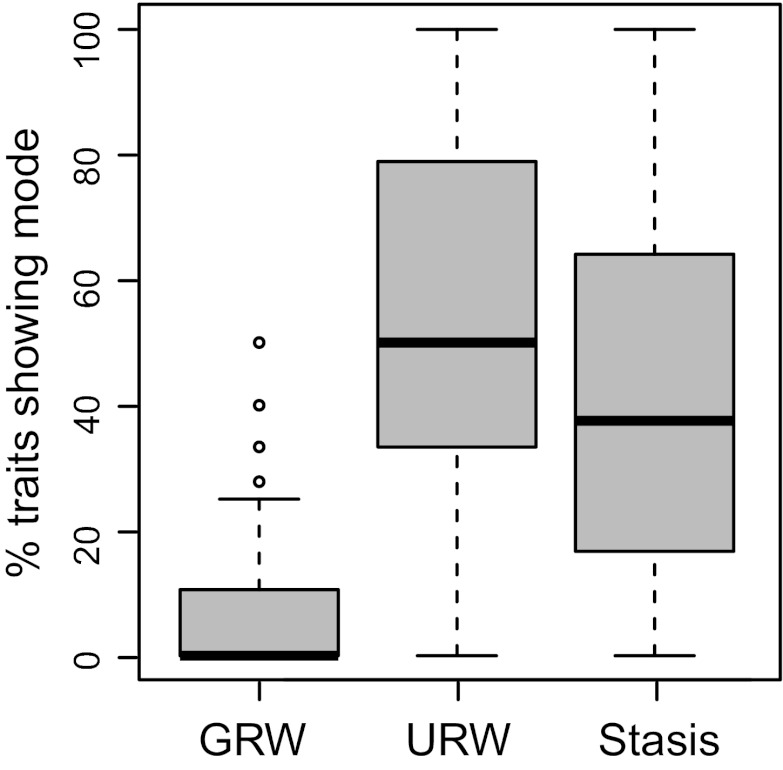
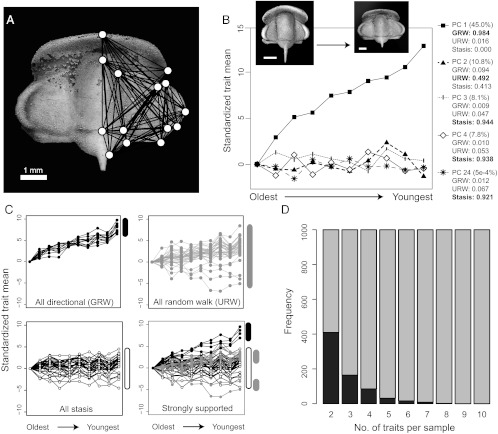
Recent studies have revitalized interest in methods for detecting evolutionary modes in both fossil sequences and phylogenies. Most of these studies examine single size or shape traits, often implicitly assuming that single phenotypic traits are adequate representations of species-level change. We test the validity of this assumption by tallying the frequency with which traits vary in evolutionary mode within fossil species lineages. After fitting models of directional change, unbiased random walk, and stasis to a dataset of 635 traits across 153 species lineages, we find that within the majority of lineages, evolutionary mode varies across traits and the likelihood of conflicting within-lineage patterns increases with the number of traits analyzed. In addition, single traits may show variation in evolutionary mode even in situations where the overall morphological evolution of the lineage is dominated by one type of mode. These quantified, stratigraphically based findings validate the idea that morphological patterns of mosaic evolution are pervasive across groups of organisms throughout Earth's history.
Conflict of interest statement
The authors declare no conflict of interest.
Figures
Similar articles
-
The relative importance of directional change, random walks, and stasis in the evolution of fossil lineages.Proc Natl Acad Sci U S A. 2007 Nov 20;104(47):18404-8. doi: 10.1073/pnas.0704088104. Epub 2007 Nov 14. Proc Natl Acad Sci U S A. 2007. PMID: 18003931 Free PMC article.
-
Tempo does not correlate with mode in the fossil record.Evolution. 2016 Dec;70(12):2678-2689. doi: 10.1111/evo.13090. Epub 2016 Nov 9. Evolution. 2016. PMID: 27748958
-
Lineage Identification Affects Estimates of Evolutionary Mode in Marine Snails.Syst Biol. 2020 Nov 1;69(6):1106-1121. doi: 10.1093/sysbio/syaa018. Syst Biol. 2020. PMID: 32163159
-
Morphological Phylogenetics in the Genomic Age.Curr Biol. 2015 Oct 5;25(19):R922-9. doi: 10.1016/j.cub.2015.07.009. Curr Biol. 2015. PMID: 26439355 Review.
-
The role of paleontological data in bryophyte systematics.J Exp Bot. 2022 Jul 16;73(13):4273-4290. doi: 10.1093/jxb/erac137. J Exp Bot. 2022. PMID: 35394022 Review.
Cited by
-
Semicircular canals in Anolis lizards: ecomorphological convergence and ecomorph affinities of fossil species.R Soc Open Sci. 2017 Oct 11;4(10):170058. doi: 10.1098/rsos.170058. eCollection 2017 Oct. R Soc Open Sci. 2017. PMID: 29134056 Free PMC article.
-
The ontogeny of Limulus polyphemus (Xiphosura s. str., Euchelicerata) revised: looking "under the skin".Dev Genes Evol. 2018 Jan;228(1):49-61. doi: 10.1007/s00427-018-0603-1. Epub 2018 Jan 29. Dev Genes Evol. 2018. PMID: 29380035
-
Identification of the mode of evolution in incomplete carbonate successions.BMC Ecol Evol. 2024 Aug 23;24(1):113. doi: 10.1186/s12862-024-02287-2. BMC Ecol Evol. 2024. PMID: 39180003 Free PMC article.
-
Evidence for an evo-devo-derived hypothesis on three-dimensional flower shape modularity in a tropical orchid clade.Evolution. 2022 Nov;76(11):2587-2604. doi: 10.1111/evo.14621. Epub 2022 Oct 1. Evolution. 2022. PMID: 36128635 Free PMC article.
-
TraitTrainR: accelerating large-scale simulation under models of continuous trait evolution.Bioinform Adv. 2024 Dec 9;5(1):vbae196. doi: 10.1093/bioadv/vbae196. eCollection 2025. Bioinform Adv. 2024. PMID: 39758830 Free PMC article.
References
-
- Hansen TF, Houle D. Evolvability, stabilizing selection, and the problem of stasis. In: Pigliucci M, Preston K, editors. Phenotypic Integration: Studying the Ecology and Evolution of Complex Phenotypes. Oxford, UK: Oxford Univ Press; 2004. pp. 130–150.
-
- Estes S, Arnold SJ. Resolving the paradox of stasis: Models with stabilizing selection explain evolutionary divergence on all timescales. Am Nat. 2007;169(2):227–244. - PubMed
-
- Eldredge N, et al. The dynamics of evolutionary stasis. Paleobiology. 2005;31:133–145.
-
- Parsons PA. Environments and evolution: Interactions between stress, resource inadequacy and energetic efficiency. Biol Rev Camb Philos Soc. 2005;80(4):589–610. - PubMed
-
- Sheldon PR. Plus ça change—A model for stasis and evolution in different environments. Palaeogeogr Palaeoclimatol Palaeoecol. 1996;127:209–227.
Publication types
MeSH terms
LinkOut - more resources
Full Text Sources
