. 2012 Nov 26;199(5):831-47.
doi: 10.1083/jcb.201209044.

Nonmedially assembled F-actin cables incorporate into the actomyosin ring in fission yeast

Affiliations

Nonmedially assembled F-actin cables incorporate into the actomyosin ring in fission yeast

Junqi Huang et al. J Cell Biol. .

Abstract

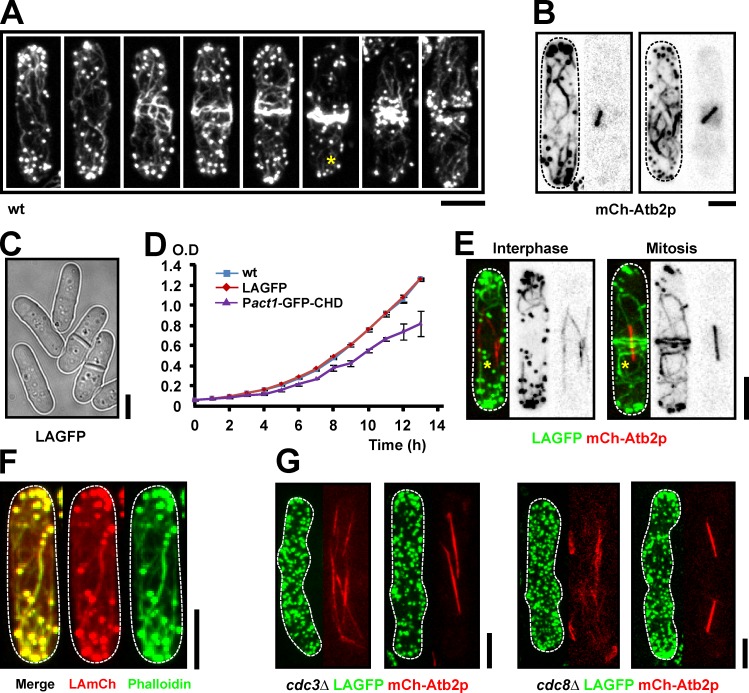
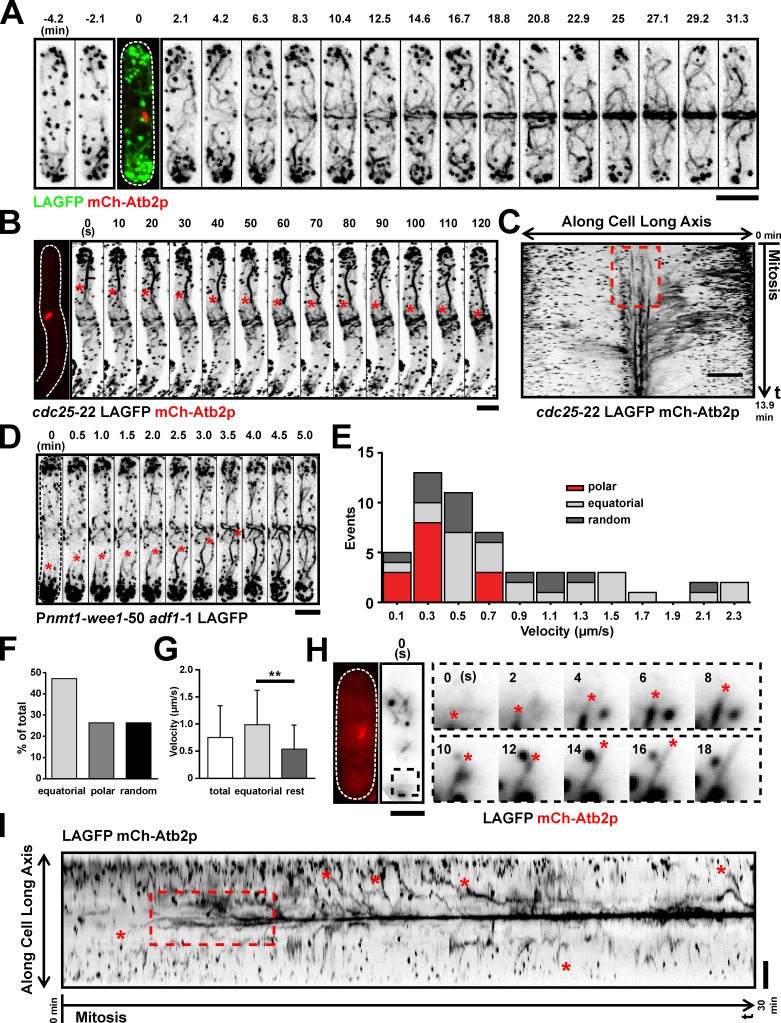
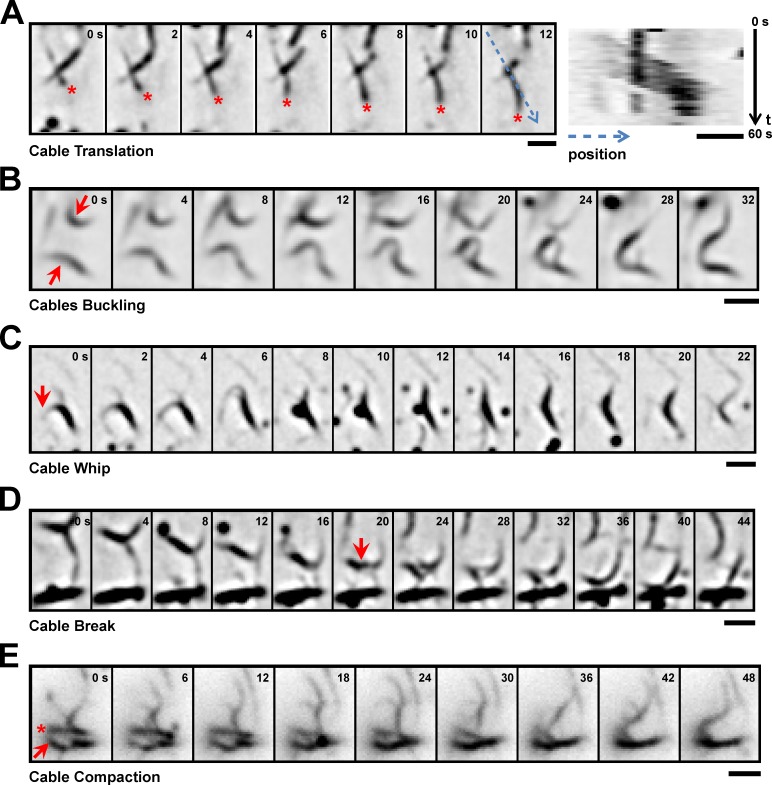
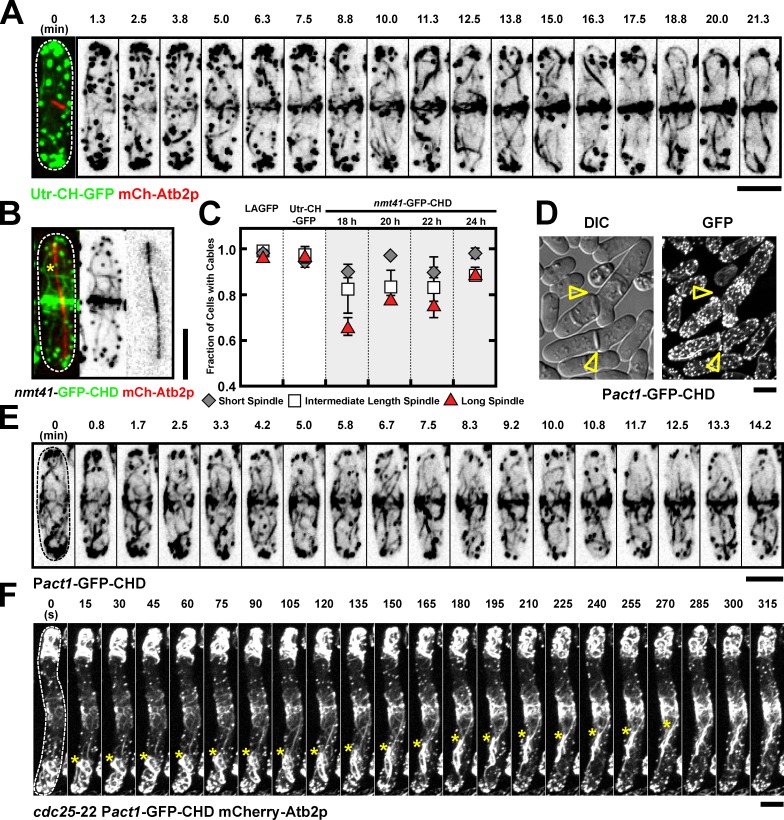
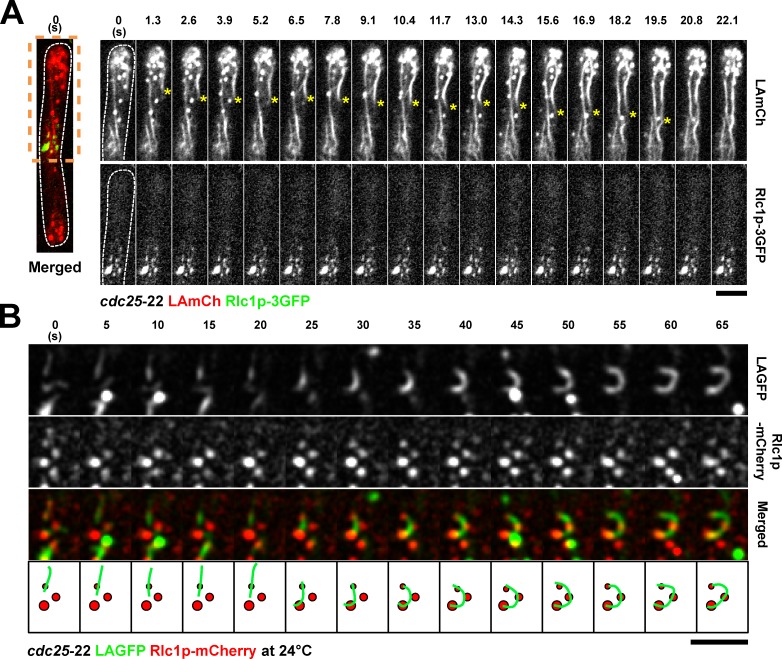
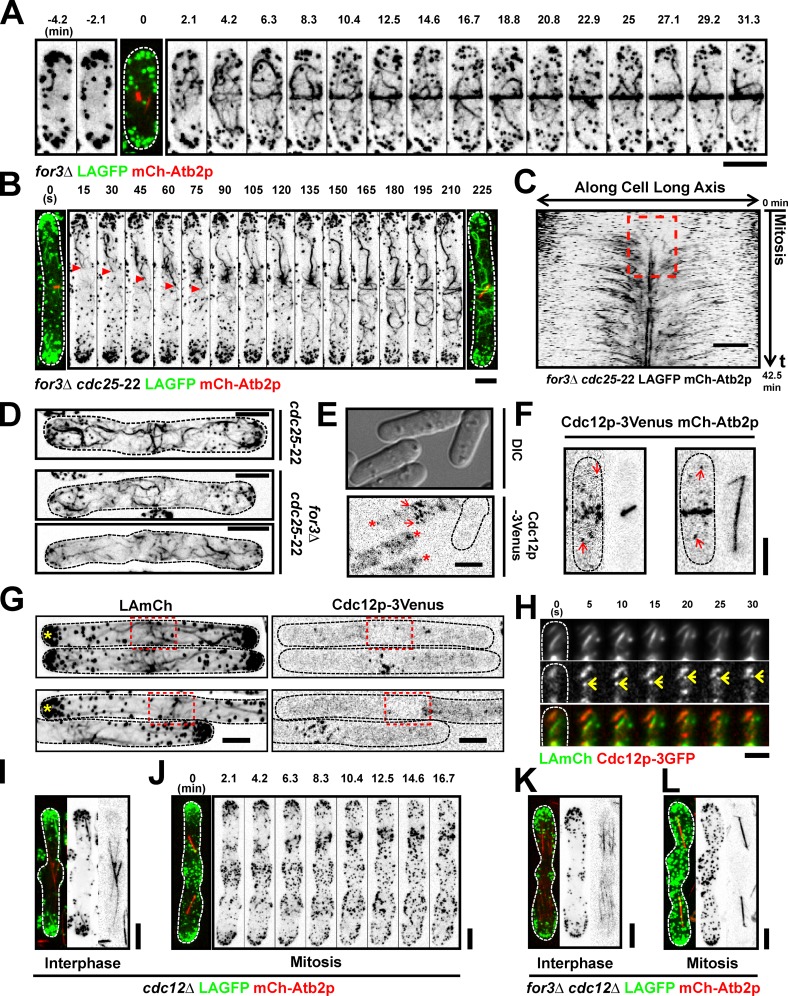
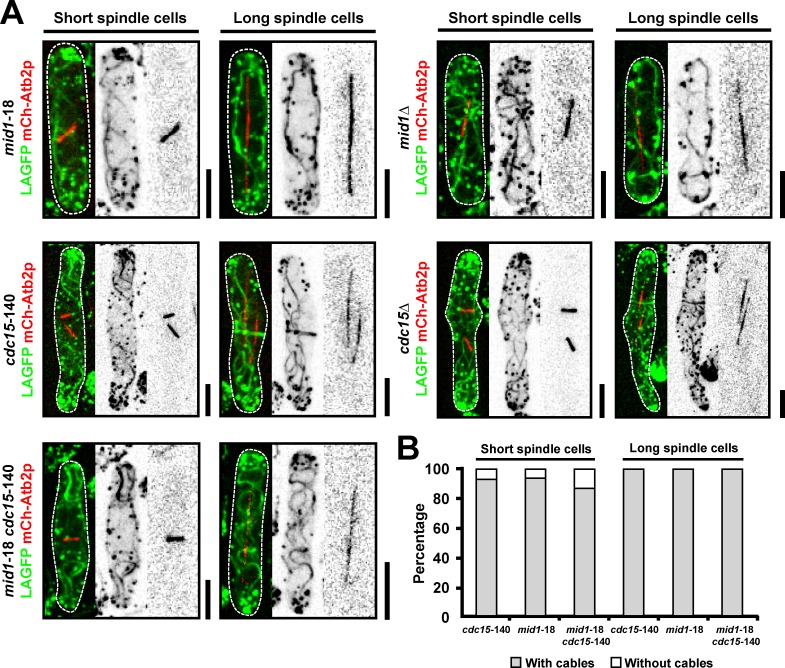
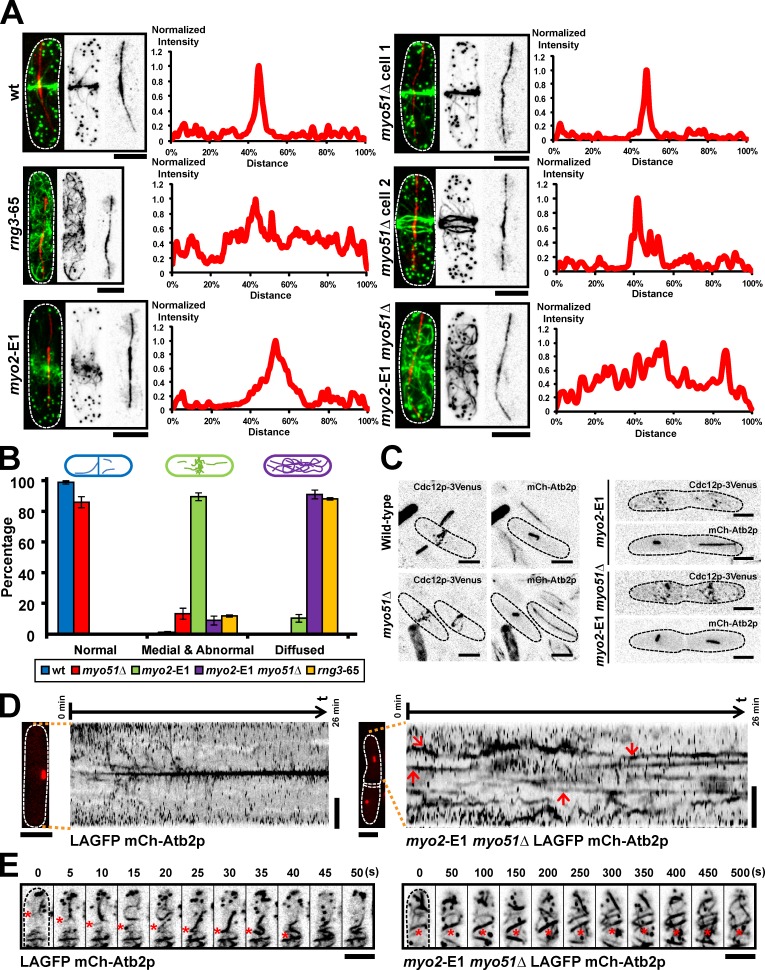
In many eukaryotes, cytokinesis requires the assembly and constriction of an actomyosin-based contractile ring. Despite the central role of this ring in cytokinesis, the mechanism of F-actin assembly and accumulation in the ring is not fully understood. In this paper, we investigate the mechanism of F-actin assembly during cytokinesis in Schizosaccharomyces pombe using lifeact as a probe to monitor actin dynamics. Previous work has shown that F-actin in the actomyosin ring is assembled de novo at the division site. Surprisingly, we find that a significant fraction of F-actin in the ring was recruited from formin-Cdc12p nucleated long actin cables that were generated at multiple nonmedial locations and incorporated into the ring by a combination of myosin II and myosin V activities. Our results, together with findings in animal cells, suggest that de novo F-actin assembly at the division site and directed transport of F-actin cables assembled elsewhere can contribute to ring assembly.


Figures

Figure 1.
Figure 1.
LA is a reliable tool to visualize F-actin in living fission yeast cells. (A) wt cells were fixed with paraformaldehyde and stained with Alexa Fluor 488 phalloidin. The asterisk shows a short cable located at the end of a mitotic cell. (B) Cells carrying mCh-Atb2p were stained as in A. (C) Bright-field image of LAGFP cells. (D) Growth curves of wt, LAGFP, and Pact1-GFP-CHD cells grown in YES at 30°C. Error bars show means ± SD of three independent experiments. (E) LAGFP mCh-Atb2p cells in interphase and mitosis. Asterisks indicate actin cables. (F) LAmCh cells were stained as in A. (G) Images of interphase and mitotic cells of cdc3Δ LAGFP mCh-Atb2p and cdc8Δ LAGFP mCh-Atb2p germinated from spores. Dashed lines indicate the cell boundary. Bars, 5 µm.
Figure 2.
Figure 2.
Nonmedially assembled actin cables migrate toward the middle during ring formation. (A) Time-lapse images of a LAGFP mCh-Atb2p cell. The third image (time 0 min) is shown as a merged image to indicate the cell cycle stage. Video 1. (B) Time-lapse images of a cdc25-22 LAGFP mCh-Atb2p cell after release from 36 to 24°C. The first micrograph on the left was taken before the video was started. Asterisks show a nonmedially assembled actin cable migrating to the medial region during ring assembly. Time interval of this video was 5 s. Video 2 (left cell). (C) Kymograph of ring assembly in a cdc25-22 LAGFP mCh-Atb2p cell revealing a flow of actin fluorescence signal to the cell middle. The broken box illustrates de novo nucleation of actin filaments at the division site. Numbers indicate the duration of the video. (D) Time-lapse images of a mitotic nmt1-wee1-50 adf1-1 LAGFP cell at 36°C. Asterisks show a cable migrating from the nonmedial region to the cell middle. Video 3 (left cell). (E) Stacked histogram showing distributions of cable extension velocities for polar, equatorial, and randomly oriented cables in mitotic LAGFP mCh-Atb2p cells. 59 cables were counted from one single experiment. (F) Graph showing the fraction of cables extending toward the cell middle (equatorial), cell poles (polar), or in other directions (random) in mitotic cells expressing LAGFP and mCh-Atb2p. 59 cables were counted from one single experiment. (G) Graph showing extension rates of cables grouped by their orientations. Error bars show means ± SD. Left to right, n = 59, 28, and 31 cables; **, P < 0.01. Data were counted from TIRFM videos in E, F, and G. (H) TIRFM images showing typical extension of an actin cable in a mitotic cell expressing LAGFP and mCh-Atb2p. The images on the left indicate the mitotic spindle and cable at the start of the video. The montage shows an extending equatorial cable (end marked with asterisks) from the black dashed box. (I) Kymograph of LAGFP signal in a wt cell passing through mitosis (Video 4). Asterisks indicate nonmedial actin cables that migrate to the middle during ring assembly. The broken box illustrates de novo nucleation of actin filaments at the division site. Numbers indicate the duration of the video. Time interval of this video was 2 s. Dashed lines indicate the cell boundary. Bars, 5 µm.
Figure 3.
Figure 3.
Examples of cable dynamics. (A) Translation of a single actin cable. The leading end is marked by an asterisk. Kymograph on the right was made by reslicing a one-pixel-wide line along the path (indicated by the blue dotted line in the 12-s time point) of the moving cable. Numbers on the right corners of the kymograph indicate the start time and end time. (B) Buckling of cables (marked by arrows). The two cables fused at the end of the sequence. (C) Whiplike bending of a cable bundle. Note the rotation of the marked (arrow) cable by nearly 180°. (D) Break in an apparently continuous cable (break position indicated by arrow). (E) Lateral translation of a cable bundle (asterisk) and incorporation into the medial ring (arrow). All images in this figure were obtained from TIRFM videos. Time points are given in seconds. Bars, 2 µm.
Figure 4.
Figure 4.
Incorporation of actin cables into the actomyosin ring can also be observed by using Utr-CH and Pact1-GFP-CHD. (A) Time-lapse images of a Utr-CH-GFP mCh-Atb2p cell. Time 0 (cell with short spindle) is shown as a merged image to indicate the cell cycle stage. Video 5 (left cell). (B) Images of an nmt41-GFP-CHD mCh-Atb2p after 20-h induction. Asterisks show cables in the nonmedial region. (C) Graph showing percentage of cells with cables in LAGFP, Utr-CH-GFP, and nmt41-GFP-CHD (18-, 20-, 22-, and 24-h induction). mCh-Atb2p was used in all these cells to measure spindle length. Cells with spindles were grouped into three categories: short, intermediate, and long spindles. Error bars show means ± SD of two independent experiments (n > 30 cells/experiment). (D) Images of Pact1-GFP-CHD cells cultured in YES. Arrowheads identify cells with septation defects. (E) Time-lapse images of a Pact1-GFP-CHD cell. Video 5 (right cells). (F) Time-lapse images of a cdc25-22 Pact1-GFP-CHD mCh-Atb2p cell after release from 36 to 24°C. Asterisks show cables migrating toward the middle. Video 6 (left cell). DIC, differential interference contrast. Dashed lines indicate the cell boundary. Bars, 5 µm.
Figure 5.
Figure 5.
Double-color imaging of nodes and LA-labeled actin cables. (A) Spinning-disk single-plane images of a cdc25-22 LAmCh Rlc1p-3GFP cell after release from 36 to 24°C. Image on the left is shown as a merged image to indicate the spatial relationship between nodes and nonmedial actin cables. Time-lapse images of the region of the cell within the orange dashed box are shown on the right. Time interval is 1.3 s. Asterisks show the migration of a nonmedial cable toward the middle. Video 7. (B) TIRFM time-lapse double-color images of a cdc25-22 LAGFP Rlc1p-mCh cell at 24°C, showing an actin cable that was captured and bent by three static Rlc1p nodes. The bottom is a schematic representation of the merged montage. Green, actin cable; red, cortical nodes. Dashed lines indicate the cell boundary. Bars, 5 µm.
Figure 6.
Figure 6.
Nonmedially assembled actin cables are nucleated by forminlike protein Cdc12p. (A) Time-lapse images of a for3Δ LAGFP mCh-Atb2p cell. The third panel (time 0 with short spindle) is shown as a merged image to indicate the cell cycle stage. Video 8 (left cell). (B) Time-lapse images of a for3Δ cdc25-22 LAGFP mCh-Atb2p cell after release from 36 to 24°C. Arrowheads point to an actin cable migrating to the cell middle during ring assembly. Video 8 (right cell). (C) Kymograph of a for3Δ cdc25-22 LAGFP mCh-Atb2p cell after release from 36 to 24°C, revealing a flow of F-actin signals from the nonmedial region to the cell middle. The broken box illustrates de novo nucleation of actin filaments at the division site. Numbers indicate duration of the video. Time interval, 15 s. (D) cdc25-22 and for3Δ cdc25-22 cells were fixed with paraformaldehyde and stained with Alexa Fluor 488 phalloidin. (E) Cdc12p-3Venus nodes (arrows) and speckles (asterisks) could be clearly distinguished from the background at 515 nm. Cdc12p-3Venus LAmCh cells and wt cells were grown in YES at 24°C and mixed before imaging. Dashed line shows the boundary of the wt cell. (F) Images of two mitotic Cdc12p-3Venus mCh-Atb2p cells. Arrows show nonmedially located Cdc12p-3Venus speckles during mitosis. (G) Maximum intensity projected images of cdc25-22 LAmCh Cdc12p-3Venus cells after release from 36 to 24°C. Asterisks point out the cells with medial accumulation of actin cables but without accumulation of Cdc12p-3Venus nodes. Red broken boxes show the medial region of the indicated cells. (H) TIRFM time-lapse double-color images of a LAmCh Cdc12p-3GFP cell, showing a Cdc12p-3GFP speckle moving rapidly along a LAmCh-labeled actin cable. Arrows point to the Cdc12p-3GFP speckle. (I) Image of an interphase cdc12Δ LAGFP mCh-Atb2p cell germinated from spore. (J) Time-lapse images of a mitotic cdc12Δ LAGFP mCh-Atb2p cell germinated from spore. Video 9 (left cell). (K and L) Images of interphase and mitotic for3Δ cdc12Δ LAGFP mCh-Atb2p cells germinated from spores. Video 9 (right cell). DIC, differential interference contrast. Dashed lines indicate the cell boundary. Bars, 5 µm.
Figure 7.
Figure 7.
Mid1p-dependent and Cdc15p-dependent pathways are dispensable for actin filament assembly. (A) mid1-18, cdc15-140, and mid1-18 cdc15-140 cells expressing LAGFP and mCh-Atb2p were shifted to 36°C and imaged by spinning-disk microscopy at 36°C. mid1Δ and cdc15Δ cells expressing LAGFP and mCh-Atb2p were grown at 24°C and imaged by spinning-disk microscopy at 24°C. The cdc15Δ LAGFP mCh-Atb2p cell was germinated from spores. (B) Quantitation of the mutant cells in A with actin cables. Cells with spindles were grouped into two categories: short and long spindles. A single representative image from three independent experiments is shown. In each experiment, 100 cells were counted for each bar. Dashed line indicates the cell boundary. Bars, 5 µm.
Figure 8.
Figure 8.
Myo2p and Myo51p participate in actin cable reorganization during actomyosin ring assembly. (A) Cells of indicated genotype (without any fluorescent marker) were treated with HU for 4 h at 24°C and then shifted to 36°C for 2.5 h. HU was washed out, and cells continued to grow at 36°C for an additional 2 h. Cells were fixed and stained with Alexa Fluor 488 phalloidin and the TAT1 antibody to visualize F-actin and tubulin, respectively. Fluorescence intensities of F-actin in various mutants were measured along the cell length. The data shown are from a single representative experiment out of more than three repeats (n ≥ 10 cells/experiment). (B) Quantitation of different F-actin localization patterns in various mutants. Error bars show means ± SD of three independent experiments (n = 100 cells/experiment). Cells were grouped into three categories based on the actin patterns. Normal: cells with normal sharp actin ring. Medial and abnormal: cells with actin cables concentrated at the medial region of the cell but not properly compacted into a ring. Diffused: cells with actin cables scattered throughout the cell. (C) Images of wt, myo2-E1, myo51Δ, and myo2-E1 myo51Δ cells expressing both Cdc12p-3Venus and mCh-Atb2p. All cells were shifted to 36°C for 4 h before imaging. (D) Kymographs of LAGFP mCh-Atb2p and myo2-E1 myo51Δ LAGFP mCh-Atb2p cells. Spinning-disk single-plane images were taken every 5 s. Maximum intensity projected mCh-Atb2p images on the left of the kymographs were taken just before the start of the videos. Arrows in the kymograph of myo2-E1 myo51Δ LAGFP mCh-Atb2p cell indicate the stable actin structures observed in mitosis. Numbers on top of each kymograph indicate the start time and end time of the video. Video 10. (E) Stable actin structures were observed in myo2-E1 myo51Δ LAGFP mCh-Atb2p cells. Cell culturing and imaging conditions were the same as in D. Asterisks in the left montage show the migration of an actin cable to the middle in LAGFP mCh-Atb2p cell. Asterisks in the right montage show the stable actin structures in myo2-E1 myo51Δ LAGFP mCh-Atb2p cell. Video 10. Dashed lines indicate the cell boundary. Bars, 5 µm.

References

    1. Alsop G.B., Chen W., Foss M., Tseng K.F., Zhang D. 2009. Redistribution of actin during assembly and reassembly of the contractile ring in grasshopper spermatocytes. PLoS ONE. 4:e4892 10.1371/journal.pone.0004892 - DOI - PMC - PubMed
    1. Arai R., Mabuchi I. 2002. F-actin ring formation and the role of F-actin cables in the fission yeast Schizosaccharomyces pombe. J. Cell Sci. 115:887–898 - PubMed
    1. Balasubramanian M.K., Helfman D.M., Hemmingsen S.M. 1992. A new tropomyosin essential for cytokinesis in the fission yeast S. pombe. Nature. 360:84–87 10.1038/360084a0 - DOI - PubMed
    1. Balasubramanian M.K., Hirani B.R., Burke J.D., Gould K.L. 1994. The Schizosaccharomyces pombe cdc3+ gene encodes a profilin essential for cytokinesis. J. Cell Biol. 125:1289–1301 10.1083/jcb.125.6.1289 - DOI - PMC - PubMed
    1. Balasubramanian M.K., McCollum D., Chang L., Wong K.C., Naqvi N.I., He X., Sazer S., Gould K.L. 1998. Isolation and characterization of new fission yeast cytokinesis mutants. Genetics. 149:1265–1275 - PMC - PubMed

Publication types