

Resolving discrepancy between nucleotides and amino acids in deep-level arthropod phylogenomics: differentiating serine codons in 21-amino-acid models
- PMID: 23185239
- PMCID: PMC3502419
- DOI: 10.1371/journal.pone.0047450
Resolving discrepancy between nucleotides and amino acids in deep-level arthropod phylogenomics: differentiating serine codons in 21-amino-acid models
Abstract
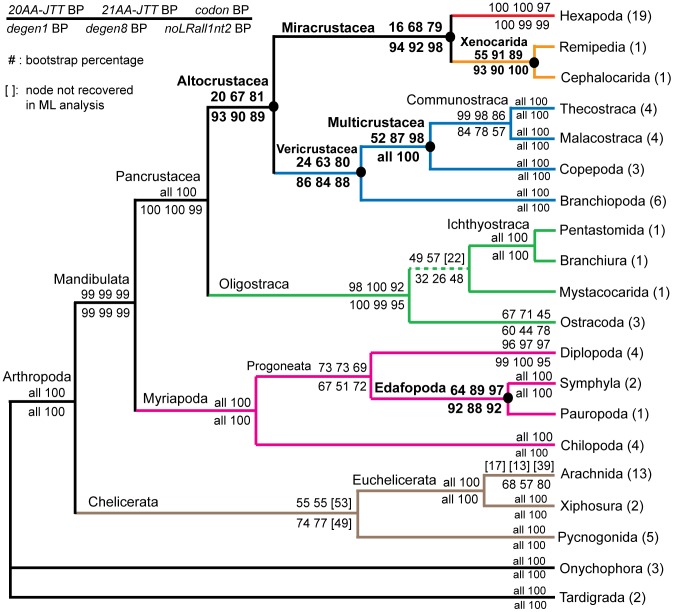
Background: In a previous study of higher-level arthropod phylogeny, analyses of nucleotide sequences from 62 protein-coding nuclear genes for 80 panarthopod species yielded significantly higher bootstrap support for selected nodes than did amino acids. This study investigates the cause of that discrepancy.
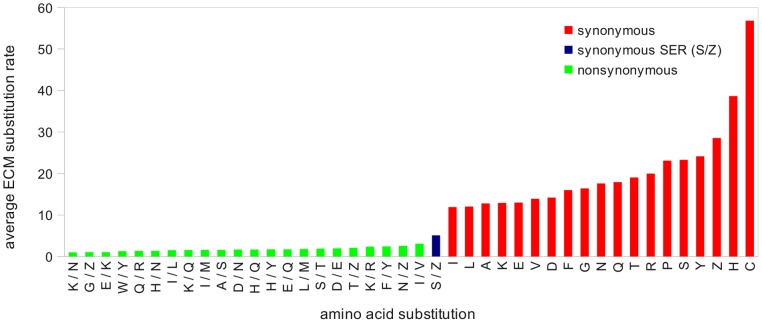
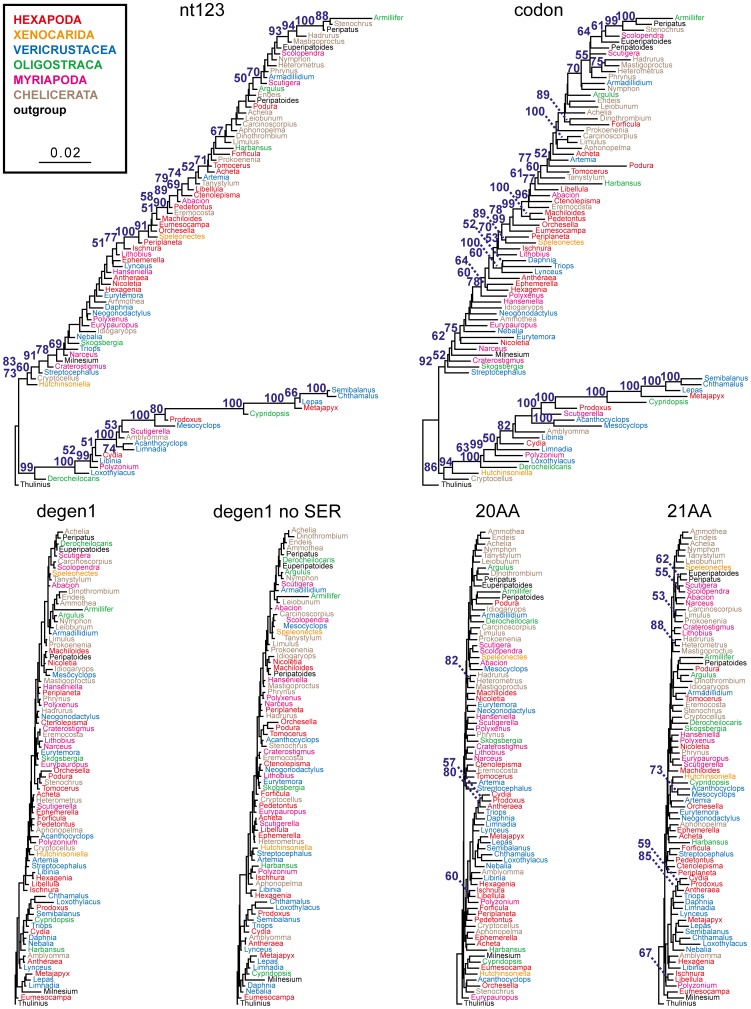
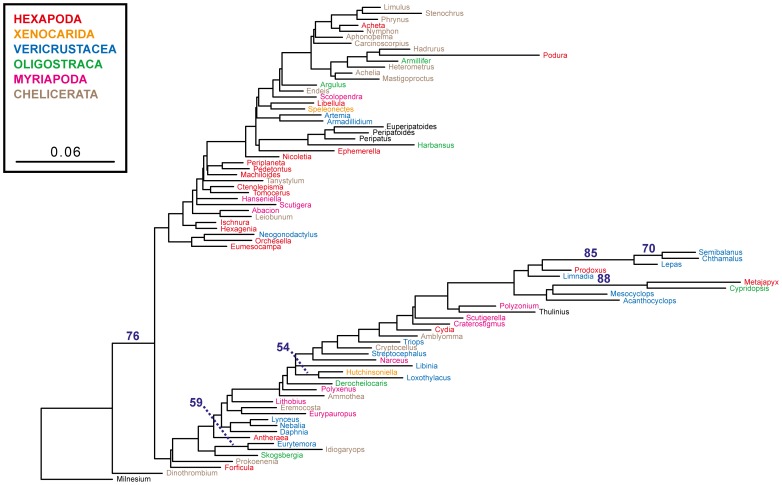
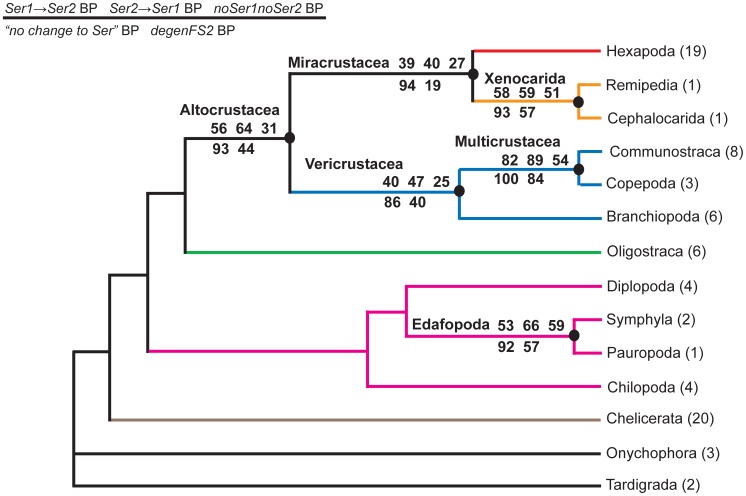
Methodology/principal findings: The hypothesis is tested that failure to distinguish the serine residues encoded by two disjunct clusters of codons (TCN, AGY) in amino acid analyses leads to this discrepancy. In one test, the two clusters of serine codons (Ser1, Ser2) are conceptually translated as separate amino acids. Analysis of the resulting 21-amino-acid data matrix shows striking increases in bootstrap support, in some cases matching that in nucleotide analyses. In a second approach, nucleotide and 20-amino-acid data sets are artificially altered through targeted deletions, modifications, and replacements, revealing the pivotal contributions of distinct Ser1 and Ser2 codons. We confirm that previous methods of coding nonsynonymous nucleotide change are robust and computationally efficient by introducing two new degeneracy coding methods. We demonstrate for degeneracy coding that neither compositional heterogeneity at the level of nucleotides nor codon usage bias between Ser1 and Ser2 clusters of codons (or their separately coded amino acids) is a major source of non-phylogenetic signal.
Conclusions: The incongruity in support between amino-acid and nucleotide analyses of the forementioned arthropod data set is resolved by showing that "standard" 20-amino-acid analyses yield lower node support specifically when serine provides crucial signal. Separate coding of Ser1 and Ser2 residues yields support commensurate with that found by degenerated nucleotides, without introducing phylogenetic artifacts. While exclusion of all serine data leads to reduced support for serine-sensitive nodes, these nodes are still recovered in the ML topology, indicating that the enhanced signal from Ser1 and Ser2 is not qualitatively different from that of the other amino acids.
Conflict of interest statement
Figures
References
-
- Lockhart PJ, Howe CJ, Bryant DA, Beanland TJ, Larkum AWD (1992) Substitutional bias confounds inference of cyanelle origins from sequence data. J Mol Evol 34: 153–162. - PubMed
-
- Gruber KF, Voss RS, Jansa SA (2007) Base-compositional heterogeneity in the RAG1 locus among didelphid marsupials: Implications for phylogenetic inference and the evolution of GC content. Syst Biol 56: 83–96. - PubMed
-
- Song H, Sheffield NC, Cameron SL, Miller KB, Whiting MF (2010) When phylogenetic assumptions are violated: Base compositional heterogeneity and among-site rate variation in beetle mitochondrial phylogenomics. Syst Ent 39: 429–448.
-
- Regier JC, Shultz JW, Zwick A, Hussey A, Ball B, et al. (2010) Arthropod relationships revealed by phylogenomic analysis of nuclear protein-coding sequences. Nature 463: 1079–1083. - PubMed
Publication types
MeSH terms
Substances
LinkOut - more resources
Full Text Sources
