

Brain structural correlates of reward sensitivity and impulsivity in adolescents with normal and excess weight
- PMID: 23185306
- PMCID: PMC3504042
- DOI: 10.1371/journal.pone.0049185
Brain structural correlates of reward sensitivity and impulsivity in adolescents with normal and excess weight
Abstract
Introduction: Neuroscience evidence suggests that adolescent obesity is linked to brain dysfunctions associated with enhanced reward and somatosensory processing and reduced impulse control during food processing. Comparatively less is known about the role of more stable brain structural measures and their link to personality traits and neuropsychological factors on the presentation of adolescent obesity. Here we aimed to investigate regional brain anatomy in adolescents with excess weight vs. lean controls. We also aimed to contrast the associations between brain structure and personality and cognitive measures in both groups.
Methods: Fifty-two adolescents (16 with normal weight and 36 with excess weight) were scanned using magnetic resonance imaging and completed the Sensitivity to Punishment and Sensitivity to Reward Questionnaire (SPSRQ), the UPPS-P scale, and the Stroop task. Voxel-based morphometry (VBM) was used to assess possible between-group differences in regional gray matter (GM) and to measure the putative differences in the way reward and punishment sensitivity, impulsivity and inhibitory control relate to regional GM volumes, which were analyzed using both region of interest (ROI) and whole brain analyses. The ROIs included areas involved in reward/somatosensory processing (striatum, somatosensory cortices) and motivation/impulse control (hippocampus, prefrontal cortex).
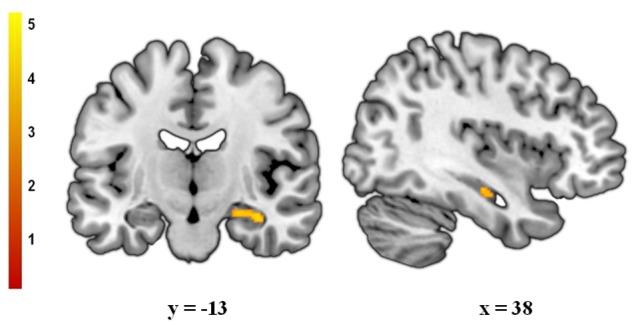
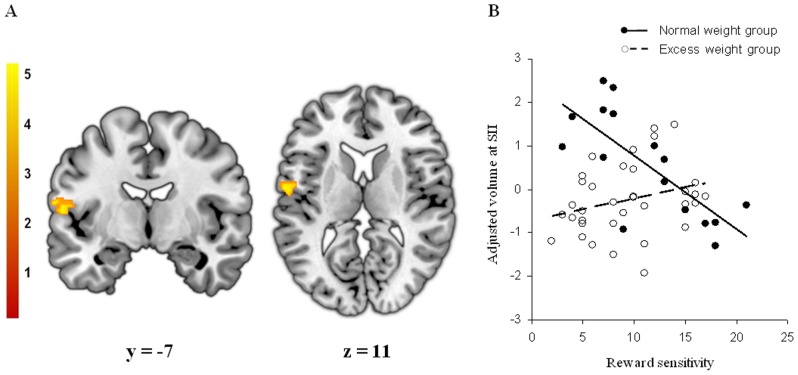
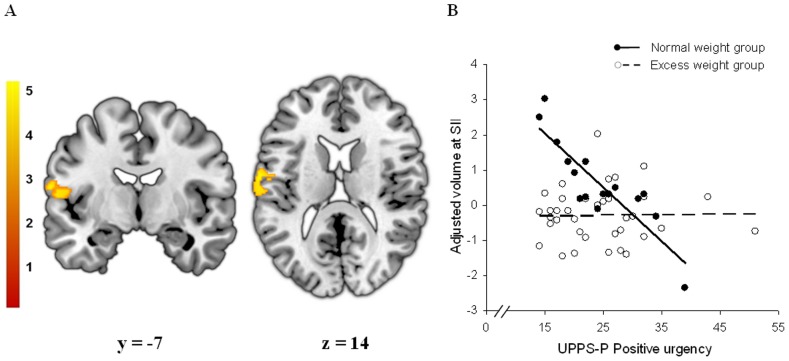
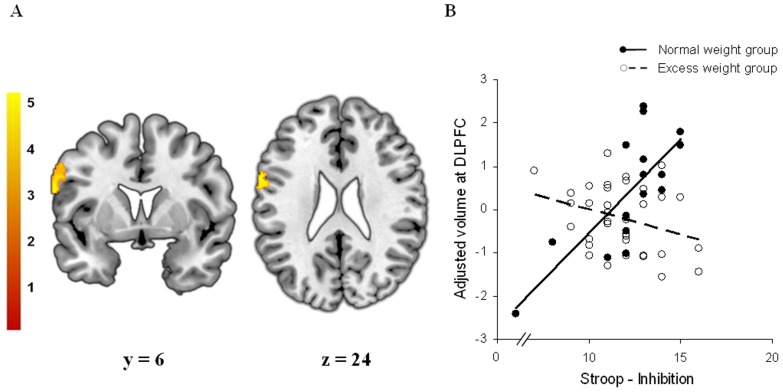
Results: Excess weight adolescents showed increased GM volume in the right hippocampus. Voxel-wise volumes of the second somatosensory cortex (SII) were correlated with reward sensitivity and positive urgency in lean controls, but this association was missed in excess weight adolescents. Moreover, Stroop performance correlated with dorsolateral prefrontal cortex volumes in controls but not in excess weight adolescents.
Conclusion: Adolescents with excess weight have structural abnormalities in brain regions associated with somatosensory processing and motivation.
Conflict of interest statement
Figures
Similar articles
-
Brain Structural Differences between Normal and Obese Adults and their Links with Lack of Perseverance, Negative Urgency, and Sensation Seeking.Sci Rep. 2017 Jan 16;7:40595. doi: 10.1038/srep40595. Sci Rep. 2017. PMID: 28091559 Free PMC article.
-
BMI predicts emotion-driven impulsivity and cognitive inflexibility in adolescents with excess weight.Obesity (Silver Spring). 2012 Aug;20(8):1604-10. doi: 10.1038/oby.2012.47. Epub 2012 Feb 23. Obesity (Silver Spring). 2012. PMID: 22421897
-
Linking personality and brain anatomy: a structural MRI approach to Reinforcement Sensitivity Theory.Soc Cogn Affect Neurosci. 2019 Mar 5;14(3):329-338. doi: 10.1093/scan/nsz011. Soc Cogn Affect Neurosci. 2019. PMID: 30753654 Free PMC article.
-
Dysfunctional involvement of emotion and reward brain regions on social decision making in excess weight adolescents.Hum Brain Mapp. 2015 Jan;36(1):226-37. doi: 10.1002/hbm.22625. Epub 2014 Aug 29. Hum Brain Mapp. 2015. PMID: 25168709 Free PMC article.
-
Relation of regional gray and white matter volumes to current BMI and future increases in BMI: a prospective MRI study.Int J Obes (Lond). 2012 May;36(5):656-64. doi: 10.1038/ijo.2011.175. Epub 2011 Sep 6. Int J Obes (Lond). 2012. PMID: 21894161 Free PMC article.
Cited by
-
Circulating progenitor cells are positively associated with cognitive function among overweight/obese children.Brain Behav Immun. 2016 Oct;57:47-52. doi: 10.1016/j.bbi.2016.03.018. Epub 2016 Apr 27. Brain Behav Immun. 2016. PMID: 27132057 Free PMC article.
-
Central nervous system regulation of eating: Insights from human brain imaging.Metabolism. 2016 May;65(5):699-713. doi: 10.1016/j.metabol.2016.02.002. Epub 2016 Feb 6. Metabolism. 2016. PMID: 27085777 Free PMC article. Review.
-
Brain-computer interface to predict impulse buying behavior using functional near-infrared spectroscopy.Sci Rep. 2022 Oct 26;12(1):18024. doi: 10.1038/s41598-022-22653-8. Sci Rep. 2022. PMID: 36289356 Free PMC article.
-
Common and distinct neural patterns of gray matter alterations in adults with anorexia nervosa and obsessive-compulsive disorder.Eur Arch Psychiatry Clin Neurosci. 2025 Jan 29. doi: 10.1007/s00406-024-01946-1. Online ahead of print. Eur Arch Psychiatry Clin Neurosci. 2025. PMID: 39875730
-
Measuring Preference for Supernormal Over Natural Rewards : A Two-Dimensional Anticipatory Pleasure Scale.Evol Psychol. 2015 Dec 1;13(4):1474704915613914. doi: 10.1177/1474704915613914. Evol Psychol. 2015. PMID: 37924197 Free PMC article.
References
-
- Stice E, Presnell K, Shaw H, Rohde P (2011) Psychological and behavioral risk factors for obesity onset in adolescent girls: a prospective study. J Consult Clin Psychol 73: 195–202. - PubMed
-
- Loxton NJ (2004) The role of impulsivity in the development of substance use and eating disorders. Neurosci Biobehav Rev 28: 343–351. - PubMed
-
- Ziauddeen H, Farooqi IS, Fletcher PC (2012) Obesity and the brain: how convincing is the addiction model?. Nat Rev Neurosci 13: 279–286. - PubMed
-
- van den Berg L, Pieterse K, Malik JA, Luman M, Willems van Dijk K, et al. (2011) Association between impulsivity, reward responsiveness and body mass index in children. Int J Obes (Lond) 35: 1301–1307. - PubMed
-
- Delgado-Rico E, Río-Valle JS, González-Jiménez E, Campoy C, Verdejo-García A (2012) BMI predicts emotion-driven impulsivity and cognitive inflexibility in adolescents with excess weight. Obesity 20: 1604–1610. - PubMed
