

doi: 10.1371/journal.pone.0049246.
Epub 2012 Nov 21.
Predicting scholars' scientific impact
Affiliations
- PMID: 23185311
- PMCID: PMC3504022
- DOI: 10.1371/journal.pone.0049246
Item in Clipboard
Predicting scholars' scientific impact
PLoS One.
2012.
Abstract
We tested the underlying assumption that citation counts are reliable predictors of future success, analyzing complete citation data on the careers of ~150,000 scientists. Our results show that i) among all citation indicators, the annual citations at the time of prediction is the best predictor of future citations, ii) future citations of a scientist's published papers can be predicted accurately (r(2) = 0.80 for a 1-year prediction, P<0.001) but iii) future citations of future work are hardly predictable.
Conflict of interest statement
Figures
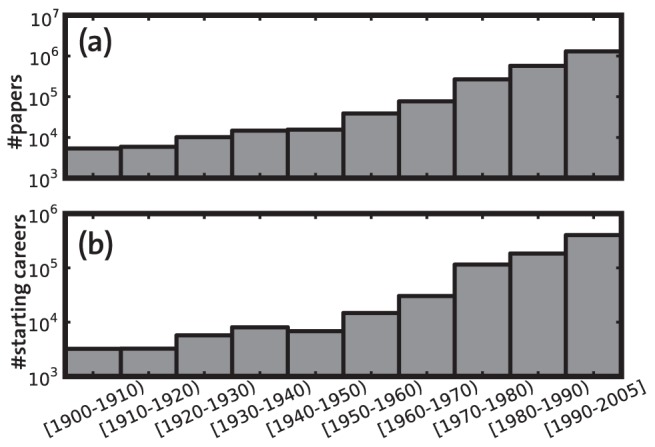
The publication year of a scientist's first paper is considered as the starting year of her career.
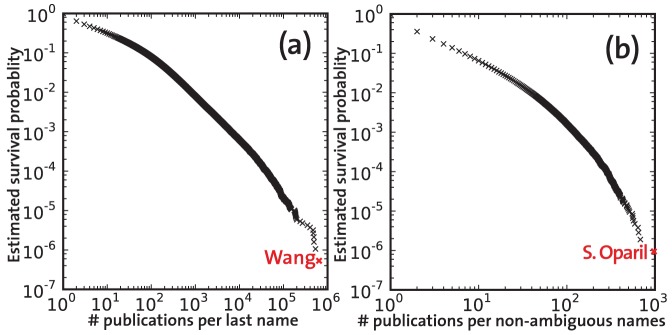
a) Cumulative distribution of the number of occurrences of family names in the author lists of distinct papers before the removal. b) Cumulative distribution of number of papers per scientists after removing ambiguous names.
 papers
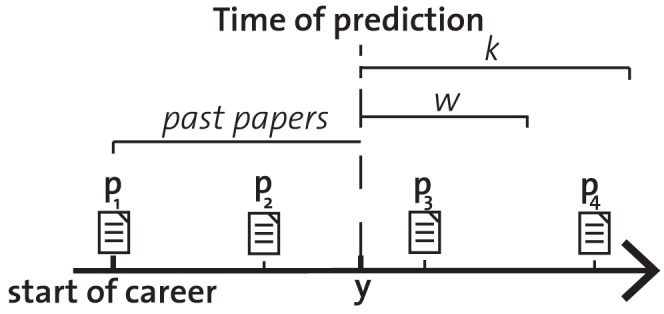
 . We consider her career from her first paper
  . At prediction point
  , we estimate the citations received in
  of both past papers (
 and
and  ), and of future papers published in
  (
( ). Paper
  is a future paper which is not published in time-window
  , and therefore excluded for the time-windows as defined by
  and
and  .
.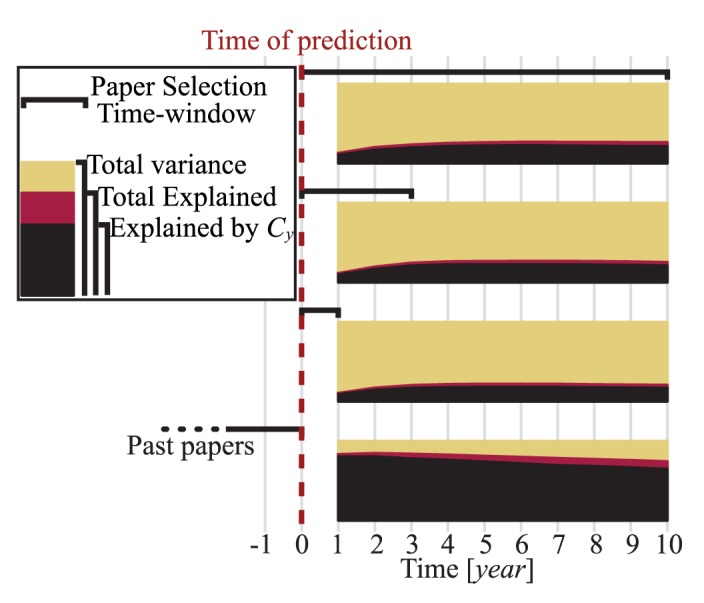
Future citations of published papers (bottom) and of future papers in 
 ,
,  , and
, and  subsequent years (marked with paper selection time-windows in top
  ) for
) for  to
to  years after the time of prediction were estimated. Explained variance by annual citations (
 ) in black; Extra explained variance by including the remaining indicators in red.
, , and subsequent years (marked with paper selection time-windows in top ) for to years after the time of prediction were estimated. Explained variance by annual citations () in black; Extra explained variance by including the remaining indicators in red.References
-
- Lehmann S, Jackson A, Lautrup B (2006) Measures for measures. Nature 444: 1003–1004. - PubMed
-
- Cohen J (2008) Where have all the dollars gone? Science 321: 520–520. - PubMed
-
- Lane J, Bertuzzi S (2011) Measuring the results of science investments. Science 331: 678. - PubMed
-
- Bornmann L, Daniel H (2005) Selection of research fellowship recipients by committee peer review. reliability, fairness and predictive validity of board of trustees' decisions. Scientometrics 63: 297–320.
-
- Petersen A, Wang F, Stanley H (2010) Methods for measuring the citations and productivity of scientists across time and discipline. Physical Review E 81: 036114. - PubMed
MeSH terms
LinkOut - more resources
Full Text Sources
