

The dynamics of nestedness predicts the evolution of industrial ecosystems
- PMID: 23185326
- PMCID: PMC3501524
- DOI: 10.1371/journal.pone.0049393
The dynamics of nestedness predicts the evolution of industrial ecosystems
Abstract
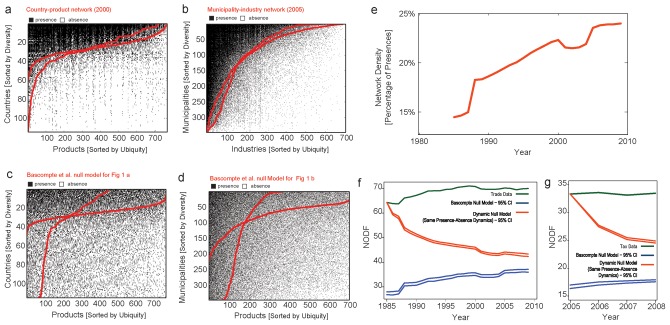
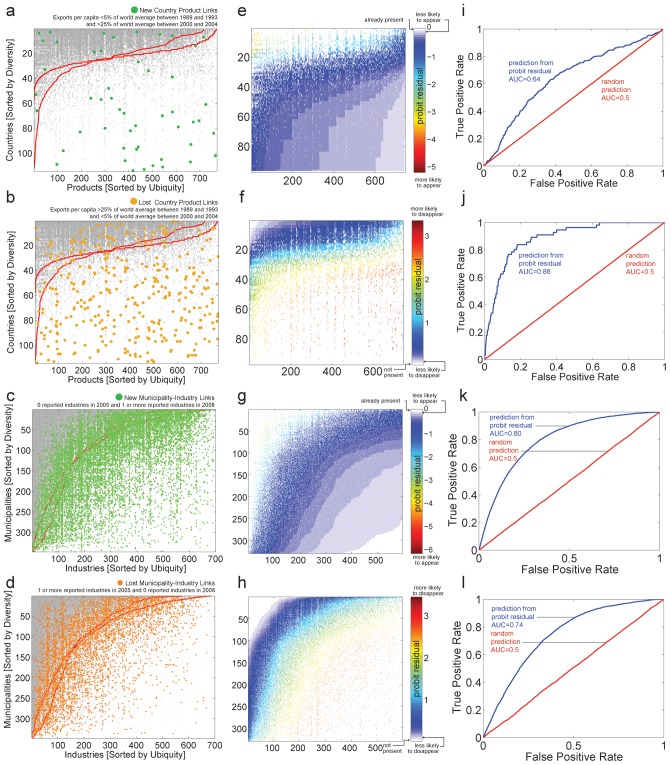
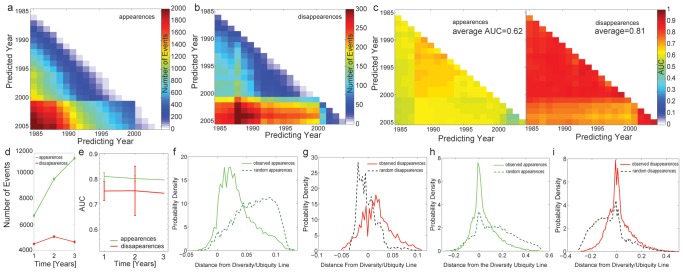
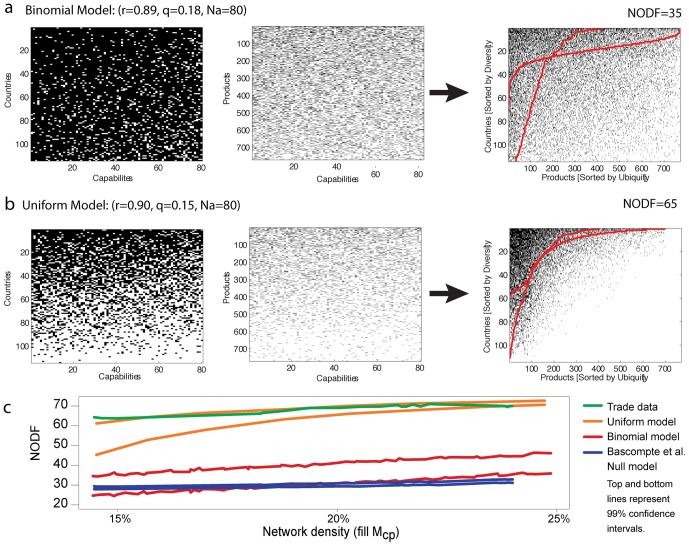
In economic systems, the mix of products that countries make or export has been shown to be a strong leading indicator of economic growth. Hence, methods to characterize and predict the structure of the network connecting countries to the products that they export are relevant for understanding the dynamics of economic development. Here we study the presence and absence of industries in international and domestic economies and show that these networks are significantly nested. This means that the less filled rows and columns of these networks' adjacency matrices tend to be subsets of the fuller rows and columns. Moreover, we show that their nestedness remains constant over time and that it is sustained by both, a bias for industries that deviate from the networks' nestedness to disappear, and a bias for the industries that are missing according to nestedness to appear. This makes the appearance and disappearance of individual industries in each location predictable. We interpret the high level of nestedness observed in these networks in the context of the neutral model of development introduced by Hidalgo and Hausmann (2009). We show that the model can reproduce the high level of nestedness observed in these networks only when we assume a high level of heterogeneity in the distribution of capabilities available in countries and required by products. In the context of the neutral model, this implies that the high level of nestedness observed in these economic networks emerges as a combination of both, the complementarity of inputs and heterogeneity in the number of capabilities available in countries and required by products. The stability of nestedness in industrial ecosystems, and the predictability implied by it, demonstrates the importance of the study of network properties in the evolution of economic networks.
Conflict of interest statement
Figures
Similar articles
-
Analysing the evolution of aerospace ecosystem development.PLoS One. 2020 Apr 28;15(4):e0231985. doi: 10.1371/journal.pone.0231985. eCollection 2020. PLoS One. 2020. PMID: 32343729 Free PMC article.
-
Coexistence of nestedness and modularity in host-pathogen infection networks.Nat Ecol Evol. 2020 Apr;4(4):568-577. doi: 10.1038/s41559-020-1130-9. Epub 2020 Mar 9. Nat Ecol Evol. 2020. PMID: 32152533
-
Network dynamics contribute to structure: nestedness in mutualistic networks.Bull Math Biol. 2013 Dec;75(12):2372-88. doi: 10.1007/s11538-013-9896-4. Epub 2013 Sep 25. Bull Math Biol. 2013. PMID: 24222037
-
The nested structural organization of the worldwide trade multi-layer network.Sci Rep. 2019 Feb 27;9(1):2866. doi: 10.1038/s41598-019-39340-w. Sci Rep. 2019. PMID: 30814565 Free PMC article.
-
Enabling Europe to innovate.Science. 2007 Jan 19;315(5810):344-7. doi: 10.1126/science.1131373. Science. 2007. PMID: 17234939 Review.
Cited by
-
The struggle for existence in the world market ecosystem.PLoS One. 2018 Oct 3;13(10):e0203915. doi: 10.1371/journal.pone.0203915. eCollection 2018. PLoS One. 2018. PMID: 30281627 Free PMC article.
-
Interpreting economic complexity.Sci Adv. 2019 Jan 9;5(1):eaau1705. doi: 10.1126/sciadv.aau1705. eCollection 2019 Jan. Sci Adv. 2019. PMID: 30662945 Free PMC article.
-
Bipartite graphs in systems biology and medicine: a survey of methods and applications.Gigascience. 2018 Apr 1;7(4):1-31. doi: 10.1093/gigascience/giy014. Gigascience. 2018. PMID: 29648623 Free PMC article. Review.
-
Analysing the evolution of aerospace ecosystem development.PLoS One. 2020 Apr 28;15(4):e0231985. doi: 10.1371/journal.pone.0231985. eCollection 2020. PLoS One. 2020. PMID: 32343729 Free PMC article.
-
Estimating the drivers of urban economic complexity and their connection to economic performance.R Soc Open Sci. 2021 Sep 22;8(9):210670. doi: 10.1098/rsos.210670. eCollection 2021 Sep. R Soc Open Sci. 2021. PMID: 34567588 Free PMC article.
References
-
- Hulten E (1937) Outline of the history of Artic and Boreal biota during the Quaternary Period, Lund University.
-
- Ulrich W, Almeida M, Gotelli NJ (2009) A consumer's guide to nestedness analysis. Oikos 118: 3–17 doi:10.1111/j.1600-0706.2008.17053.x. - DOI
-
- Darlington PJ (1957) Zoogeography: the geographical distribution of animals. Wiley
-
- Daubenmire R (1975) Floristic plant geography of eastern Washington and northern Idaho. Journal of Biogeography 2.
-
- Bascompte J, Jordano P, Melian CJ, Olesen JM (2003) The nested assembly of plant-animal mutualistic networks. Proceedings of the National Academy of Sciences of the United States of America 100: 9383–9387 doi:10.1073/pnas.1633576100. - DOI - PMC - PubMed
Publication types
MeSH terms
LinkOut - more resources
Full Text Sources
