

Unexpected relationships and inbreeding in HapMap phase III populations
- PMID: 23185369
- PMCID: PMC3501496
- DOI: 10.1371/journal.pone.0049575
Unexpected relationships and inbreeding in HapMap phase III populations
Abstract
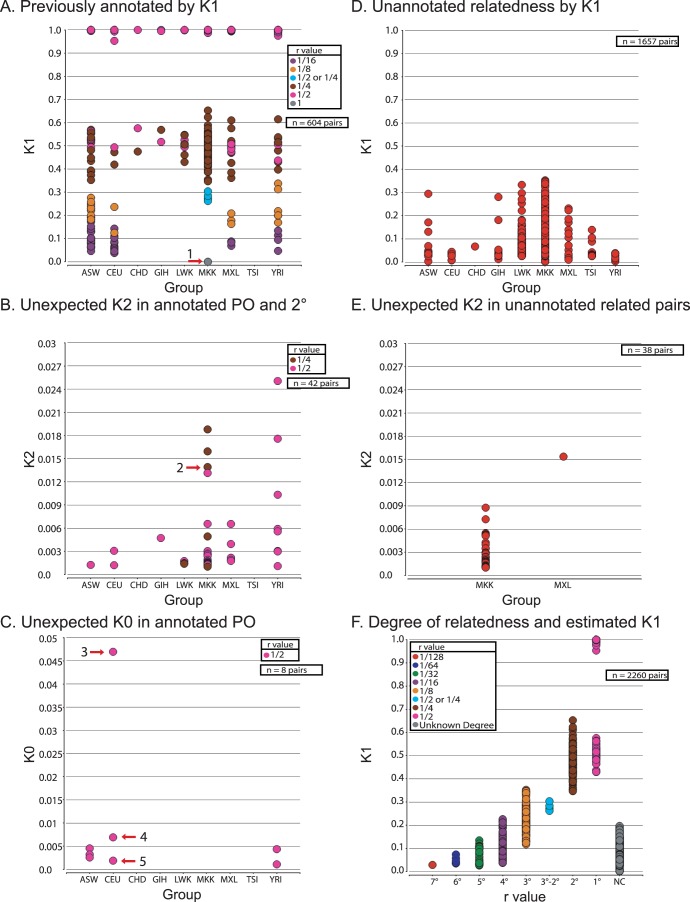
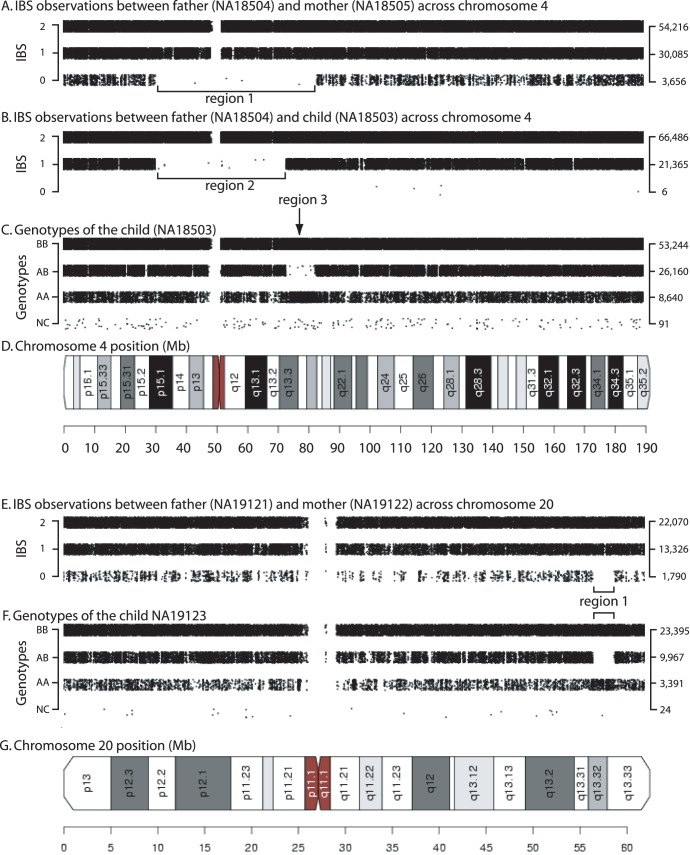
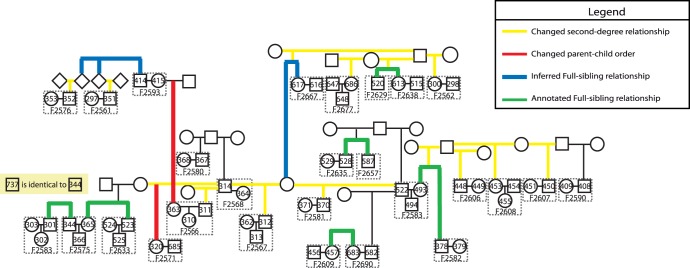
Correct annotation of the genetic relationships between samples is essential for population genomic studies, which could be biased by errors or omissions. To this end, we used identity-by-state (IBS) and identity-by-descent (IBD) methods to assess genetic relatedness of individuals within HapMap phase III data. We analyzed data from 1,397 individuals across 11 ethnic populations. Our results support previous studies (Pemberton et al., 2010; Kyriazopoulou-Panagiotopoulou et al., 2011) assessing unknown relatedness present within this population. Additionally, we present evidence for 1,657 novel pairwise relationships across 9 populations. Surprisingly, significant Cotterman's coefficients of relatedness K1 (IBD1) values were detected between pairs of known parents. Furthermore, significant K2 (IBD2) values were detected in 32 previously annotated parent-child relationships. Consistent with a hypothesis of inbreeding, regions of homozygosity (ROH) were identified in the offspring of related parents, of which a subset overlapped those reported in previous studies (Gibson et al. 2010; Johnson et al. 2011). In total, we inferred 28 inbred individuals with ROH that overlapped areas of relatedness between the parents and/or IBD2 sharing at a different genomic locus between a child and a parent. Finally, 8 previously annotated parent-child relationships had unexpected K0 (IBD0) values (resulting from a chromosomal abnormality or genotype error), and 10 previously annotated second-degree relationships along with 38 other novel pairwise relationships had unexpected IBD2 (indicating two separate paths of recent ancestry). These newly described types of relatedness may impact the outcome of previous studies and should inform the design of future studies relying on the HapMap Phase III resource.
Conflict of interest statement
Figures
Similar articles
-
Consanguinity in Centre d'Étude du Polymorphisme Humain (CEPH) pedigrees.Eur J Hum Genet. 2012 Jun;20(6):657-67. doi: 10.1038/ejhg.2011.266. Epub 2012 Jan 25. Eur J Hum Genet. 2012. PMID: 22274586 Free PMC article.
-
Inference of relationships in population data using identity-by-descent and identity-by-state.PLoS Genet. 2011 Sep;7(9):e1002287. doi: 10.1371/journal.pgen.1002287. Epub 2011 Sep 22. PLoS Genet. 2011. PMID: 21966277 Free PMC article.
-
Inference of unexpected genetic relatedness among individuals in HapMap Phase III.Am J Hum Genet. 2010 Oct 8;87(4):457-64. doi: 10.1016/j.ajhg.2010.08.014. Am J Hum Genet. 2010. PMID: 20869033 Free PMC article.
-
Runs of homozygosity: current knowledge and applications in livestock.Anim Genet. 2017 Jun;48(3):255-271. doi: 10.1111/age.12526. Epub 2016 Dec 1. Anim Genet. 2017. PMID: 27910110 Review.
-
Identity by descent between distant relatives: detection and applications.Annu Rev Genet. 2012;46:617-33. doi: 10.1146/annurev-genet-110711-155534. Epub 2012 Sep 17. Annu Rev Genet. 2012. PMID: 22994355 Review.
Cited by
-
Separation of the largest eigenvalues in eigenanalysis of genotype data from discrete subpopulations.Theor Popul Biol. 2013 Nov;89:34-43. doi: 10.1016/j.tpb.2013.08.004. Epub 2013 Aug 20. Theor Popul Biol. 2013. PMID: 23973732 Free PMC article.
-
Determining the genome-wide kinship coefficient seems unhelpful in distinguishing consanguineous couples with a high versus low risk for adverse reproductive outcome.BMC Med Genet. 2015 Jul 20;16:50. doi: 10.1186/s12881-015-0191-0. BMC Med Genet. 2015. PMID: 26188928 Free PMC article.
-
Inference of kinship using spatial distributions of SNPs for genome-wide association studies.BMC Genomics. 2016 May 20;17:372. doi: 10.1186/s12864-016-2696-0. BMC Genomics. 2016. PMID: 27206321 Free PMC article.
-
Profiling and Leveraging Relatedness in a Precision Medicine Cohort of 92,455 Exomes.Am J Hum Genet. 2018 May 3;102(5):874-889. doi: 10.1016/j.ajhg.2018.03.012. Am J Hum Genet. 2018. PMID: 29727688 Free PMC article.
-
Analysis of Heritability Using Genome-Wide Data.Curr Protoc Hum Genet. 2016 Oct 11;91:1.30.1-1.30.10. doi: 10.1002/cphg.25. Curr Protoc Hum Genet. 2016. PMID: 27727439 Free PMC article.
References
-
- Donnelly P (2008) Progress and challenges in genome-wide association studies in humans. Nature 456: 728–731. - PubMed
MeSH terms
Grants and funding
LinkOut - more resources
Full Text Sources
Research Materials
