

Unimpaired skin carcinogenesis in Desmoglein 3 knockout mice
- PMID: 23185521
- PMCID: PMC3503716
- DOI: 10.1371/journal.pone.0050024
Unimpaired skin carcinogenesis in Desmoglein 3 knockout mice
Abstract
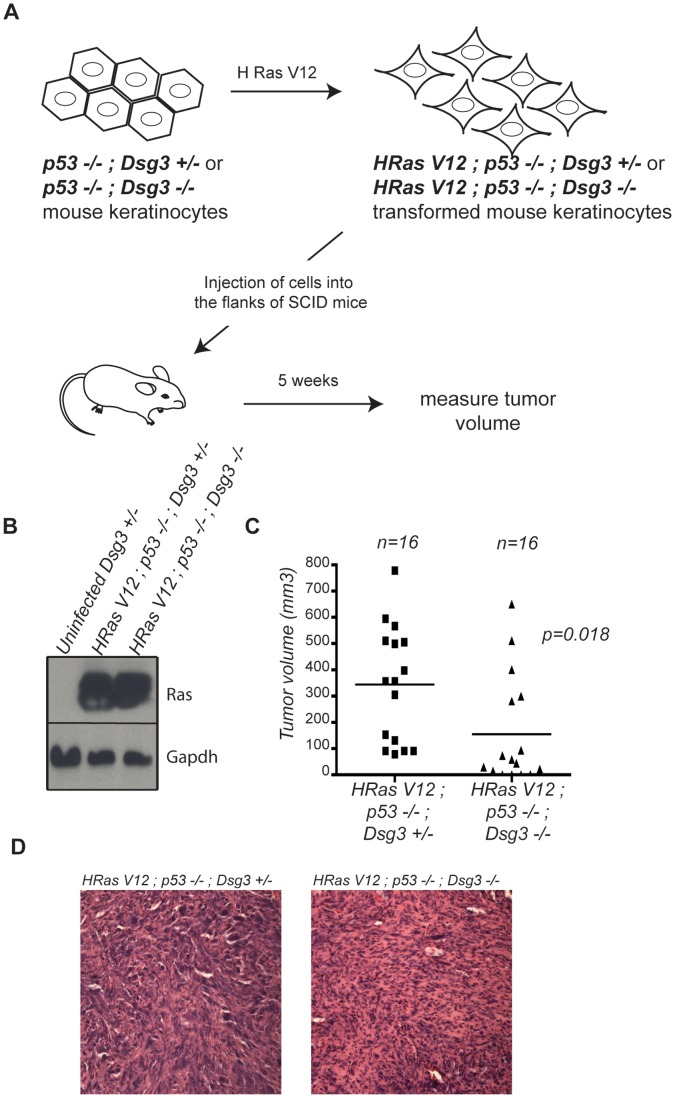
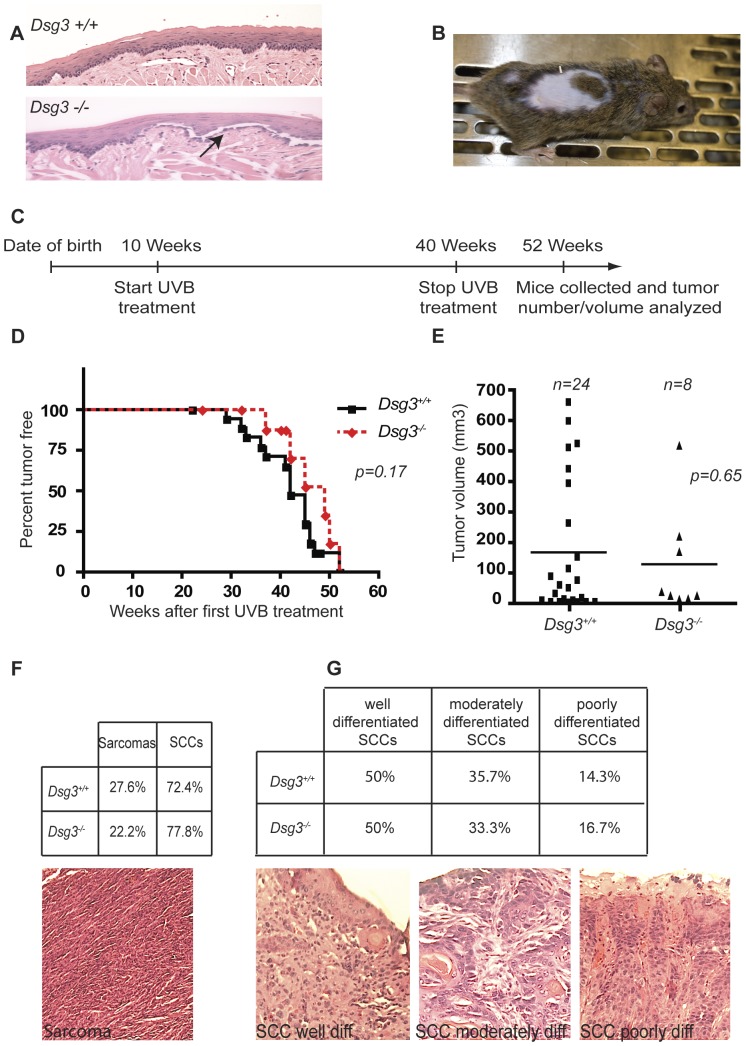
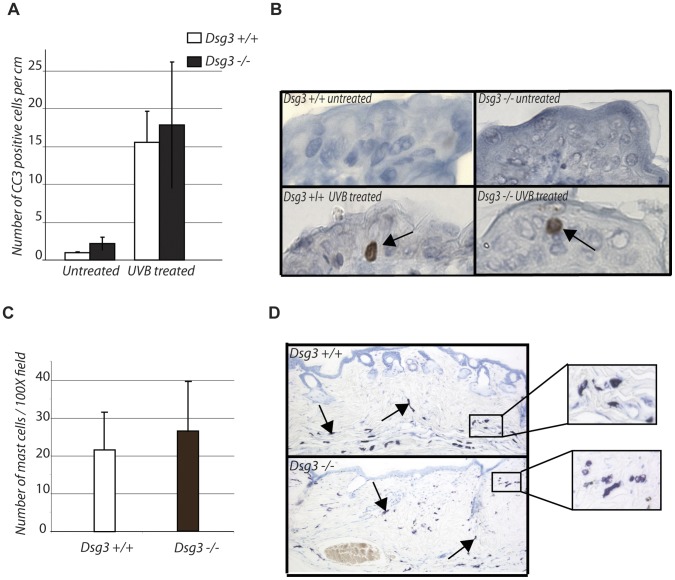
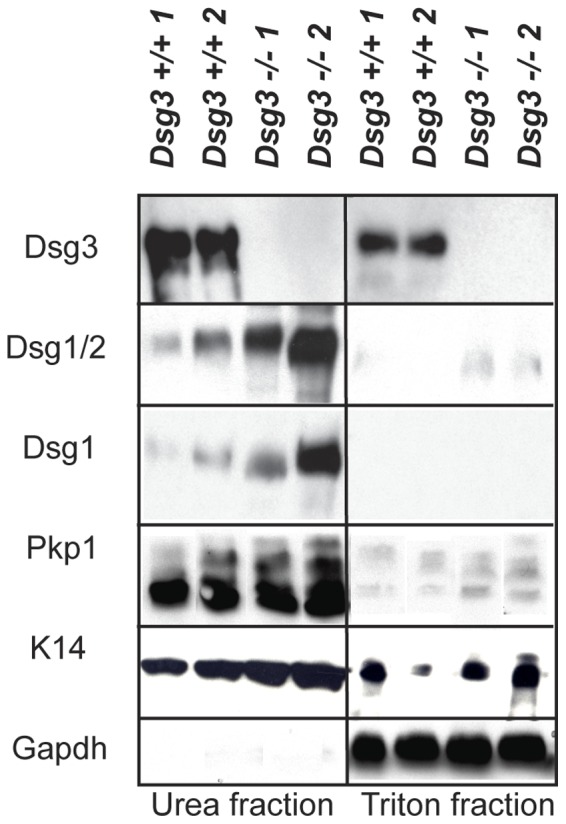
The contribution of adherens junction inactivation, typically by downregulation or mutation of the transmembrane core component E-cadherin, to cancer progression is well recognized. In contrast, the role of the desmosomal cadherin components of the related cell-cell adhesion junction, the desmosome, in cancer development has not been well explored. Here, we use mouse models to probe the functional role of desmosomal cadherins in carcinogenesis. Because mice lacking the desmosomal cadherin Desmoglein 3 (Dsg3) have revealed a crucial role for Dsg3 in cell-cell adhesion in stratified epithelia, we investigate the consequence of Dsg3 loss in two models of skin carcinogenesis. First, using Dsg3-/- keratinocytes, we show that these cells display adhesion defects in vitro and compromised tumor growth in allograft assays, suggesting that Dsg3 enables tumor formation in certain settings. In contrast, using an autochthonous model for SCC development in response to chronic UVB treatment, we discover a surprising lack of enhanced tumorigenesis in Dsg3-/- mice relative to controls, unlike mice lacking the desmosomal component Perp. Accordingly, there is no defect in the apoptotic response to UVB or enhanced immune cell infiltration upon Dsg3 loss that could promote tumorigenesis. Thus, Dsg3 does not display a clear function as a tumor suppressor in these mouse skin cancer models. Continued unraveling of the roles of Dsg3 and other desmosomal constituents in carcinogenesis in different contexts will be important for ultimately improving cancer diagnosis, prognostication, and treatment.
Conflict of interest statement
Figures

Similar articles
-
Loss of the p53/p63 regulated desmosomal protein Perp promotes tumorigenesis.PLoS Genet. 2010 Oct 21;6(10):e1001168. doi: 10.1371/journal.pgen.1001168. PLoS Genet. 2010. PMID: 20975948 Free PMC article.
-
E-cadherin and Src associate with extradesmosomal Dsg3 and modulate desmosome assembly and adhesion.Cell Mol Life Sci. 2015 Dec;72(24):4885-97. doi: 10.1007/s00018-015-1977-0. Epub 2015 Jun 27. Cell Mol Life Sci. 2015. PMID: 26115704 Free PMC article.
-
Desmoglein 3 regulates membrane trafficking of cadherins, an implication in cell-cell adhesion.Cell Adh Migr. 2017 May 4;11(3):211-232. doi: 10.1080/19336918.2016.1195942. Epub 2016 Jun 2. Cell Adh Migr. 2017. PMID: 27254775 Free PMC article.
-
Desmosomal adhesion and pemphigus vulgaris: the first half of the story.Cell Commun Adhes. 2013 Feb;20(1-2):1-10. doi: 10.3109/15419061.2013.763799. Epub 2013 Feb 1. Cell Commun Adhes. 2013. PMID: 23368972 Review.
-
Desmoglein 3, its pathogenecity and a possibility for therapeutic target in pemphigus vulgaris.Expert Opin Ther Targets. 2013 Mar;17(3):293-306. doi: 10.1517/14728222.2013.744823. Epub 2013 Jan 8. Expert Opin Ther Targets. 2013. PMID: 23294403 Review.
Cited by
-
Autoantibody-Specific Signalling in Pemphigus.Front Med (Lausanne). 2021 Aug 9;8:701809. doi: 10.3389/fmed.2021.701809. eCollection 2021. Front Med (Lausanne). 2021. PMID: 34434944 Free PMC article. Review.
-
Desmoglein 3: a help or a hindrance in cancer progression?Cancers (Basel). 2015 Jan 26;7(1):266-86. doi: 10.3390/cancers7010266. Cancers (Basel). 2015. PMID: 25629808 Free PMC article. Review.
-
Desmosomal Cadherins in Health and Disease.Annu Rev Pathol. 2022 Jan 24;17:47-72. doi: 10.1146/annurev-pathol-042320-092912. Epub 2021 Aug 23. Annu Rev Pathol. 2022. PMID: 34425055 Free PMC article. Review.
-
Desmoglein 2 compensates for desmoglein 3 but does not control cell adhesion via regulation of p38 mitogen-activated protein kinase in keratinocytes.J Biol Chem. 2014 Jun 13;289(24):17043-53. doi: 10.1074/jbc.M113.489336. Epub 2014 Apr 29. J Biol Chem. 2014. PMID: 24782306 Free PMC article.
-
Desmosomes: regulators of cellular signaling and adhesion in epidermal health and disease.Cold Spring Harb Perspect Med. 2014 Nov 3;4(11):a015297. doi: 10.1101/cshperspect.a015297. Cold Spring Harb Perspect Med. 2014. PMID: 25368015 Free PMC article. Review.
References
-
- Green KJ, Gaudry CA (2000) Are desmosomes more than tethers for intermediate filaments? Nature reviews Molecular cell biology 1: 208–216. - PubMed
-
- Yin T, Green KJ (2004) Regulation of desmosome assembly and adhesion. Seminars in cell & developmental biology 15: 665–677. - PubMed
-
- Nose A, Tsuji K, Takeichi M (1990) Localization of specificity determining sites in cadherin cell adhesion molecules. Cell 61: 147–155. - PubMed
Publication types
MeSH terms
Substances
Grants and funding
LinkOut - more resources
Full Text Sources
Medical
Molecular Biology Databases
Research Materials
Miscellaneous
