

Monitoring cortical excitability during repetitive transcranial magnetic stimulation in children with ADHD: a single-blind, sham-controlled TMS-EEG study
- PMID: 23185537
- PMCID: PMC3503808
- DOI: 10.1371/journal.pone.0050073
Monitoring cortical excitability during repetitive transcranial magnetic stimulation in children with ADHD: a single-blind, sham-controlled TMS-EEG study
Abstract
Background: Repetitive transcranial magnetic stimulation (rTMS) allows non-invasive stimulation of the human brain. However, no suitable marker has yet been established to monitor the immediate rTMS effects on cortical areas in children.
Objective: TMS-evoked EEG potentials (TEPs) could present a well-suited marker for real-time monitoring. Monitoring is particularly important in children where only few data about rTMS effects and safety are currently available.
Methods: In a single-blind sham-controlled study, twenty-five school-aged children with ADHD received subthreshold 1 Hz-rTMS to the primary motor cortex. The TMS-evoked N100 was measured by 64-channel-EEG pre, during and post rTMS, and compared to sham stimulation as an intraindividual control condition.
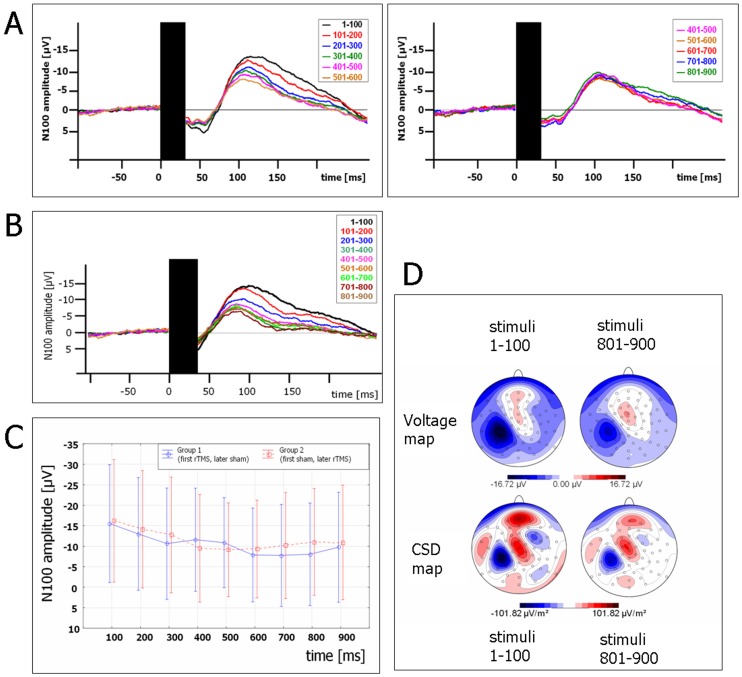
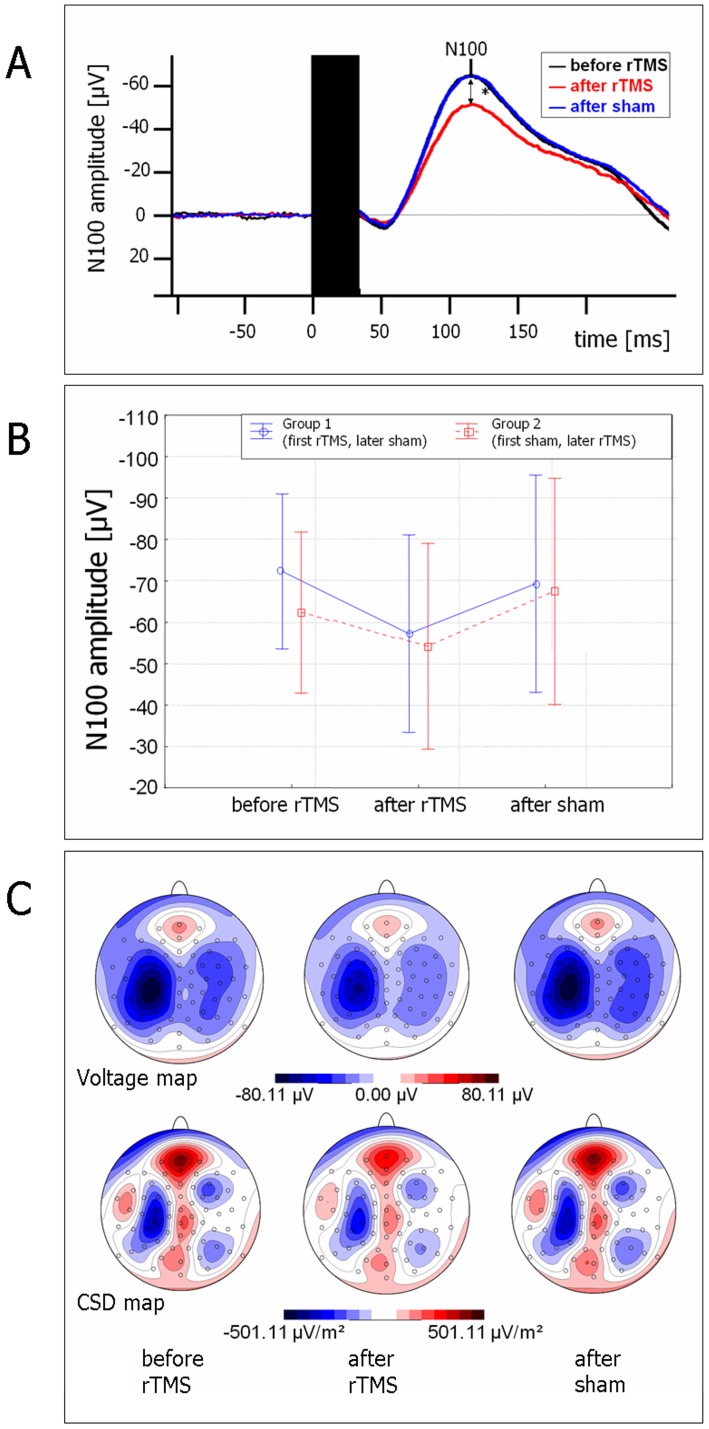
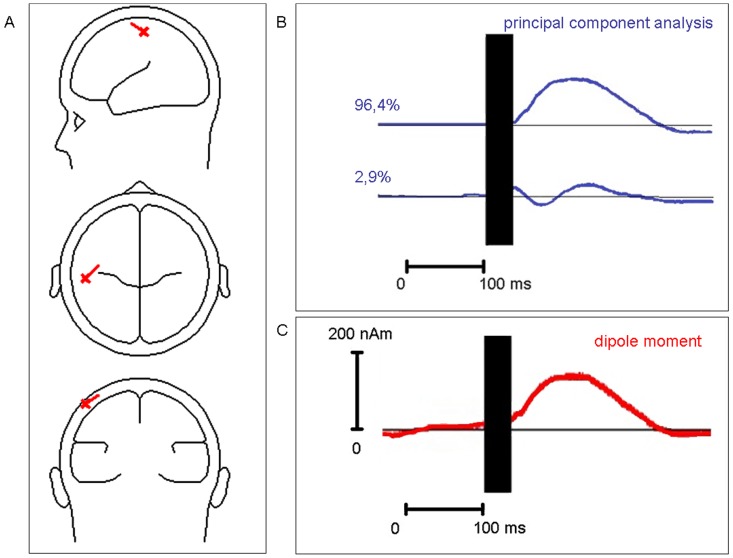
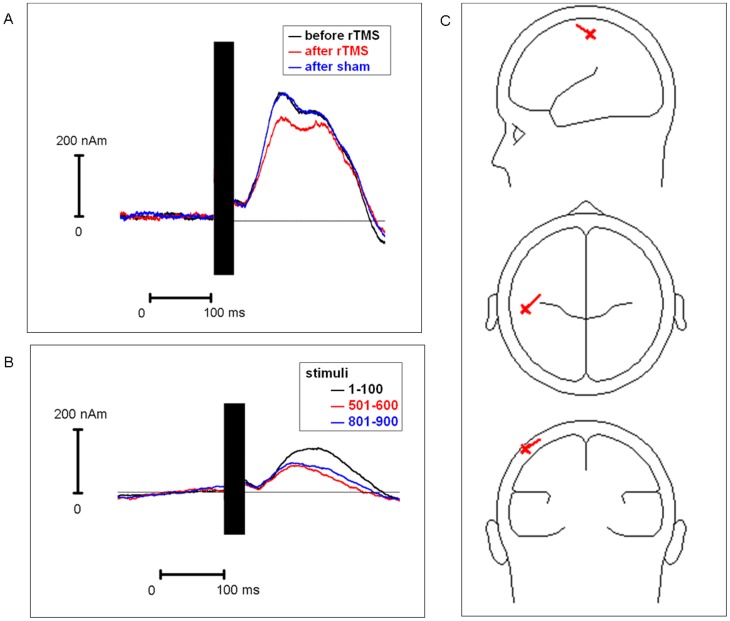
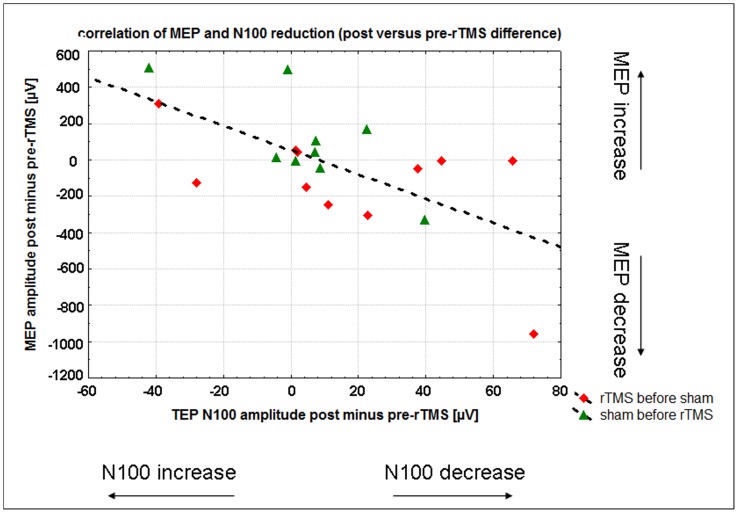
Results: TMS-evoked N100 amplitude decreased during 1 Hz-rTMS and, at the group level, reached a stable plateau after approximately 500 pulses. N100 amplitude to supra-threshold single pulses post rTMS confirmed the amplitude reduction in comparison to the pre-rTMS level while sham stimulation had no influence. EEG source analysis indicated that the TMS-evoked N100 change reflected rTMS effects in the stimulated motor cortex. Amplitude changes in TMS-evoked N100 and MEPs (pre versus post 1 Hz-rTMS) correlated significantly, but this correlation was also found for pre versus post sham stimulation.
Conclusion: The TMS-evoked N100 represents a promising candidate marker to monitor rTMS effects on cortical excitability in children with ADHD. TMS-evoked N100 can be employed to monitor real-time effects of TMS for subthreshold intensities. Though TMS-evoked N100 was a more sensitive parameter for rTMS-specific changes than MEPs in our sample, further studies are necessary to demonstrate whether clinical rTMS effects can be predicted from rTMS-induced changes in TMS-evoked N100 amplitude and to clarify the relationship between rTMS-induced changes in TMS-evoked N100 and MEP amplitudes. The TMS-evoked N100 amplitude reduction after 1 Hz-rTMS could either reflect a globally decreased cortical response to the TMS pulse or a specific decrease in inhibition.
Conflict of interest statement
Figures
Similar articles
-
Motor cortical inhibition in ADHD: modulation of the transcranial magnetic stimulation-evoked N100 in a response control task.J Neural Transm (Vienna). 2014;121(3):315-25. doi: 10.1007/s00702-013-1097-7. Epub 2013 Oct 15. J Neural Transm (Vienna). 2014. PMID: 24126573
-
Low-frequency rTMS inhibitory effects in the primary motor cortex: Insights from TMS-evoked potentials.Neuroimage. 2014 Sep;98:225-32. doi: 10.1016/j.neuroimage.2014.04.065. Epub 2014 May 2. Neuroimage. 2014. PMID: 24793831
-
Cortical inhibition in attention deficit hyperactivity disorder: new insights from the electroencephalographic response to transcranial magnetic stimulation.Brain. 2012 Jul;135(Pt 7):2215-30. doi: 10.1093/brain/aws071. Epub 2012 Apr 3. Brain. 2012. PMID: 22492560
-
[Transcranial magnetic stimulation (TMS), inhibition processes and attention deficit/hyperactivity disorder (ADHD) - an overview].Z Kinder Jugendpsychiatr Psychother. 2014 Nov;42(6):415-28; quiz 428-9. doi: 10.1024/1422-4917/a000320. Z Kinder Jugendpsychiatr Psychother. 2014. PMID: 25335520 Review. German.
-
Cortical excitability on sleep deprivation measured by transcranial magnetic stimulation: A systematic review and meta-analysis.Brain Res Bull. 2025 Feb;221:111190. doi: 10.1016/j.brainresbull.2025.111190. Epub 2025 Jan 3. Brain Res Bull. 2025. PMID: 39756660
Cited by
-
Noninvasive Brain Stimulation in Pediatric Attention-Deficit Hyperactivity Disorder (ADHD): A Review.J Child Neurol. 2016 May;31(6):784-96. doi: 10.1177/0883073815615672. Epub 2015 Dec 10. J Child Neurol. 2016. PMID: 26661481 Free PMC article. Review.
-
Safety of Transcranial Magnetic Stimulation in Children: A Systematic Review of the Literature.Pediatr Neurol. 2017 Mar;68:3-17. doi: 10.1016/j.pediatrneurol.2016.12.009. Epub 2017 Jan 4. Pediatr Neurol. 2017. PMID: 28216033 Free PMC article.
-
Non-invasive Brain Stimulation for the Rehabilitation of Children and Adolescents With Neurodevelopmental Disorders: A Systematic Review.Front Psychol. 2019 Feb 6;10:135. doi: 10.3389/fpsyg.2019.00135. eCollection 2019. Front Psychol. 2019. PMID: 30787895 Free PMC article.
-
Stimulation-Based Control of Dynamic Brain Networks.PLoS Comput Biol. 2016 Sep 9;12(9):e1005076. doi: 10.1371/journal.pcbi.1005076. eCollection 2016 Sep. PLoS Comput Biol. 2016. PMID: 27611328 Free PMC article.
-
Single-Pulse TMS to the Temporo-Occipital and Dorsolateral Prefrontal Cortex Evokes Lateralized Long Latency EEG Responses at the Stimulation Site.Front Neurosci. 2021 Mar 12;15:616667. doi: 10.3389/fnins.2021.616667. eCollection 2021. Front Neurosci. 2021. PMID: 33790732 Free PMC article.
References
-
- Huang Y-Z, Edwards MJ, Rounis E, Bhatia KP, Rothwell JC (2005) Theta Burst Stimulation of the Human Motor Cortex. Neuron 45: 201–206 doi:10.1016/j.neuron.2004.12.033 - DOI - PubMed
-
- Rossi S, Pasqualetti P, Rossini PM, Feige B, Ulivelli M, et al. (2000) Effects of repetitive transcranial magnetic stimulation on movement-related cortical activity in humans. Cereb Cortex 10: 802–808. - PubMed
-
- Ziemann U, Paulus W, Nitsche MA, Pascual-Leone A, Byblow WD, et al. (2008) Consensus: Motor cortex plasticity protocols. Brain Stimul 1: 164–182 doi:10.1016/j.brs.2008.06.006 - DOI - PubMed
-
- Siebner HR, Lang N, Rizzo V, Nitsche MA, Paulus W, et al. (2004) Preconditioning of low-frequency repetitive transcranial magnetic stimulation with transcranial direct current stimulation: evidence for homeostatic plasticity in the human motor cortex. J Neurosci 24: 3379–3385 doi:10.1523/JNEUROSCI.5316-03.2004 - DOI - PMC - PubMed
-
- Rossi S, Hallett M, Rossini PM, Pascual-Leone A (2009) Safety, ethical considerations, and application guidelines for the use of transcranial magnetic stimulation in clinical practice and research. Clin Neurophysiol 120: 2008–2039 doi:10.1016/j.clinph.2009.08.016 - DOI - PMC - PubMed
Publication types
MeSH terms
Substances
LinkOut - more resources
Full Text Sources
Medical
