

Cognitive processing speed in older adults: relationship with white matter integrity
- PMID: 23185621
- PMCID: PMC3503892
- DOI: 10.1371/journal.pone.0050425
Cognitive processing speed in older adults: relationship with white matter integrity
Abstract
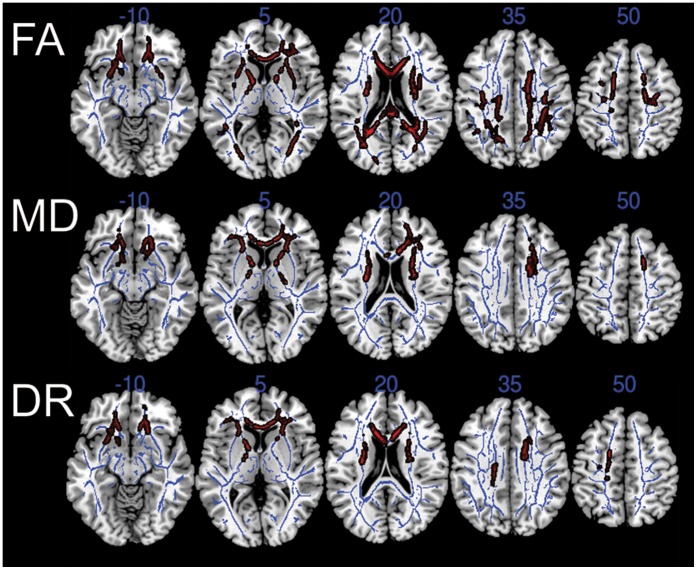
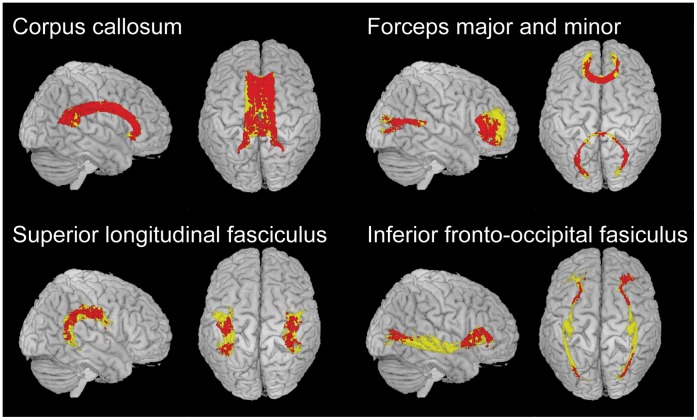
Cognitive processing slows with age. We sought to determine the importance of white matter integrity, assessed by diffusion tensor imaging (DTI), at influencing cognitive processing speed among normal older adults, assessed using a novel battery of computerized, non-verbal, choice reaction time tasks. We studied 131 cognitively normal adults aged 55-87 using a cross-sectional design. Each participant underwent our test battery, as well as MRI with DTI. We carried out cross-subject comparisons using tract-based spatial statistics. As expected, reaction time slowed significantly with age. In diffuse areas of frontal and parietal white matter, especially the anterior corpus callosum, fractional anisotropy values correlated negatively with reaction time. The genu and body of the corpus callosum, superior longitudinal fasciculus, and inferior fronto-occipital fasciculus were among the areas most involved. This relationship was not explained by gray or white matter atrophy or by white matter lesion volume. In a statistical mediation analysis, loss of white matter integrity mediated the relationship between age and cognitive processing speed.
Conflict of interest statement
Figures


Similar articles
-
Aging, cognition, and the brain: effects of age-related variation in white matter integrity on neuropsychological function.Aging Ment Health. 2019 Jul;23(7):831-839. doi: 10.1080/13607863.2018.1455804. Epub 2018 Apr 10. Aging Ment Health. 2019. PMID: 29634290
-
Cerebral white matter integrity mediates adult age differences in cognitive performance.J Cogn Neurosci. 2009 Feb;21(2):289-302. doi: 10.1162/jocn.2009.21047. J Cogn Neurosci. 2009. PMID: 18564054 Free PMC article.
-
Aging white matter and cognition: differential effects of regional variations in diffusion properties on memory, executive functions, and speed.Neuropsychologia. 2009 Feb;47(3):916-27. doi: 10.1016/j.neuropsychologia.2009.01.001. Epub 2009 Jan 8. Neuropsychologia. 2009. PMID: 19166865 Free PMC article.
-
Longitudinal changes in fiber tract integrity in healthy aging and mild cognitive impairment: a DTI follow-up study.J Alzheimers Dis. 2010;22(2):507-22. doi: 10.3233/JAD-2010-100234. J Alzheimers Dis. 2010. PMID: 20847446
-
Structural Integrity in the Genu of Corpus Callosum Predicts Conflict-induced Functional Connectivity Between Medial Frontal Cortex and Right Posterior Parietal Cortex.Neuroscience. 2017 Dec 16;366:162-171. doi: 10.1016/j.neuroscience.2017.10.017. Epub 2017 Oct 31. Neuroscience. 2017. PMID: 29080715
Cited by
-
Age-related Changes in the Structure and Dynamics of the Semantic Network.Lang Cogn Neurosci. 2022;37(7):805-819. doi: 10.1080/23273798.2021.2019286. Epub 2022 Mar 6. Lang Cogn Neurosci. 2022. PMID: 36262380 Free PMC article.
-
General Slowing and Education Mediate Task Switching Performance Across the Life-Span.Front Psychol. 2018 May 4;9:630. doi: 10.3389/fpsyg.2018.00630. eCollection 2018. Front Psychol. 2018. PMID: 29780341 Free PMC article.
-
Structural Neural Correlates of Double Decision Performance in Older Adults.Front Aging Neurosci. 2020 Sep 2;12:278. doi: 10.3389/fnagi.2020.00278. eCollection 2020. Front Aging Neurosci. 2020. PMID: 33117145 Free PMC article.
-
Wisdom and fluid intelligence are dissociable in healthy older adults.Int Psychogeriatr. 2022 Mar;34(3):229-239. doi: 10.1017/S1041610221000521. Epub 2021 May 10. Int Psychogeriatr. 2022. PMID: 33966673 Free PMC article.
-
Math skills and microstructure of the middle longitudinal fasciculus: A developmental investigation.PLoS One. 2025 Jun 11;20(6):e0324802. doi: 10.1371/journal.pone.0324802. eCollection 2025. PLoS One. 2025. PMID: 40498707 Free PMC article.
References
-
- Cerella J, Hale S (1994) The rise and fall in information-processing rates over the life span. Acta Psychologica 86: 109–197. - PubMed
-
- Jenkins L, Myerson J, Joerding JA, Hale S (2000) Converging evidence that visuospatial cognition is more age-sensitive than verbal cognition. Psychology and Aging 15: 157–175. - PubMed
-
- Abe O, Aoki S, Hayashi N, Yamada H, Kunimatsu A, et al. (2002) Normal aging in the central nervous system: Quantitative MR diffusion-tensor analysis. Neurobiology of Aging 23: 433–441. - PubMed
-
- Barrick TR, Charlton RA, Clark CA, Markus HS (2010) White matter structural decline in normal ageing: A prospective longitudinal study using tract-based spatial statistics. NeuroImage 51: 565–577. - PubMed
Publication types
MeSH terms
Grants and funding
LinkOut - more resources
Full Text Sources
Medical
Research Materials
