. 2012;7(11):e50500.
doi: 10.1371/journal.pone.0050500. Epub 2012 Nov 21.

PPARγ agonists promote oligodendrocyte differentiation of neural stem cells by modulating stemness and differentiation genes

Affiliations

PPARγ agonists promote oligodendrocyte differentiation of neural stem cells by modulating stemness and differentiation genes

Saravanan Kanakasabai et al. PLoS One. 2012.

Abstract

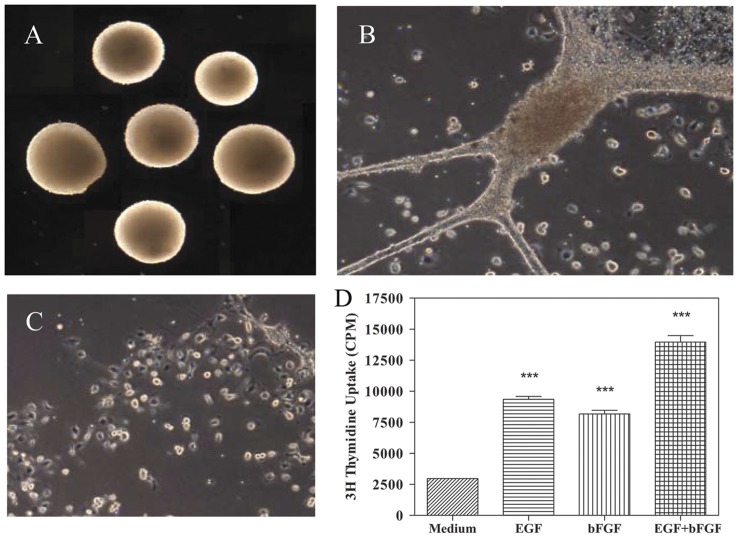
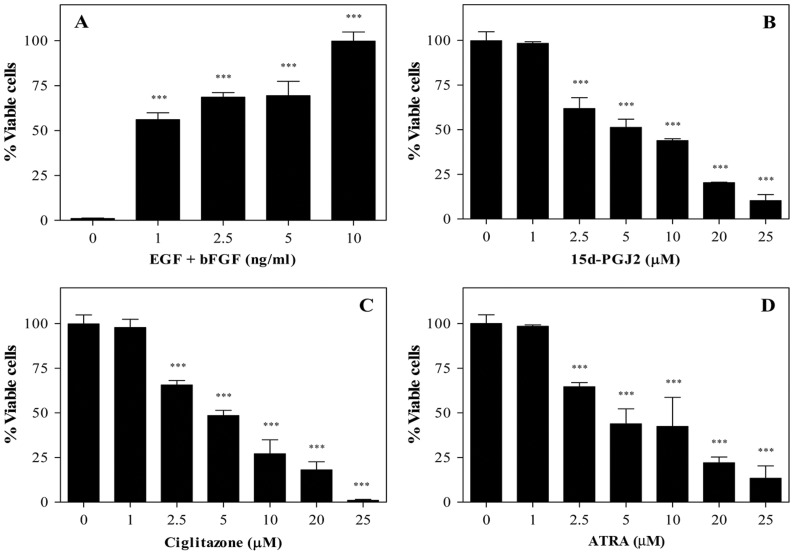
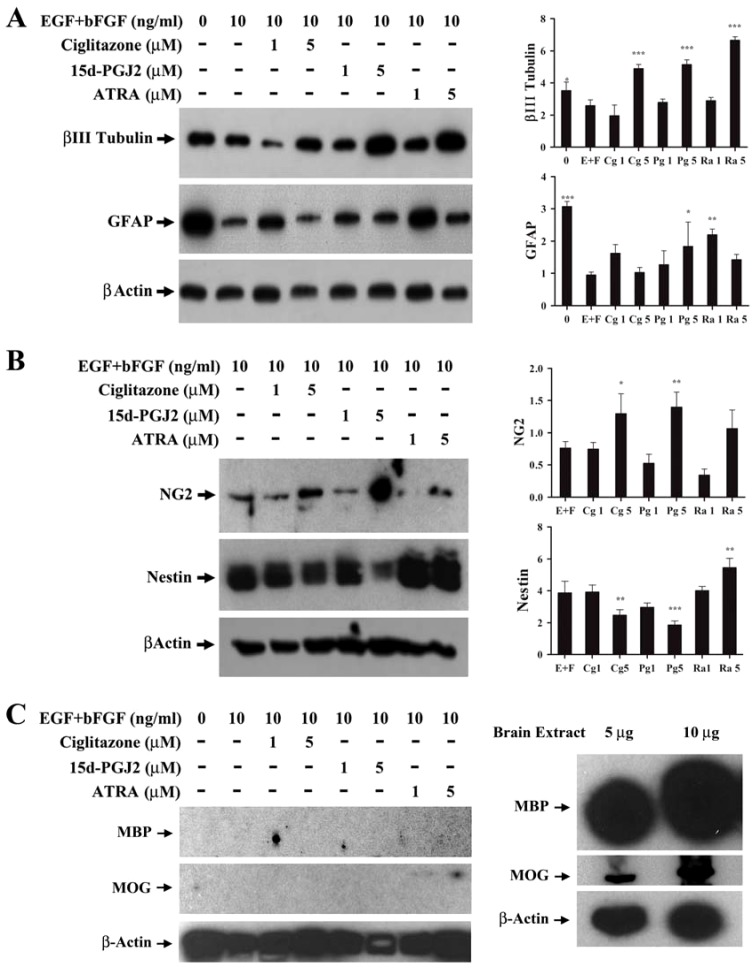
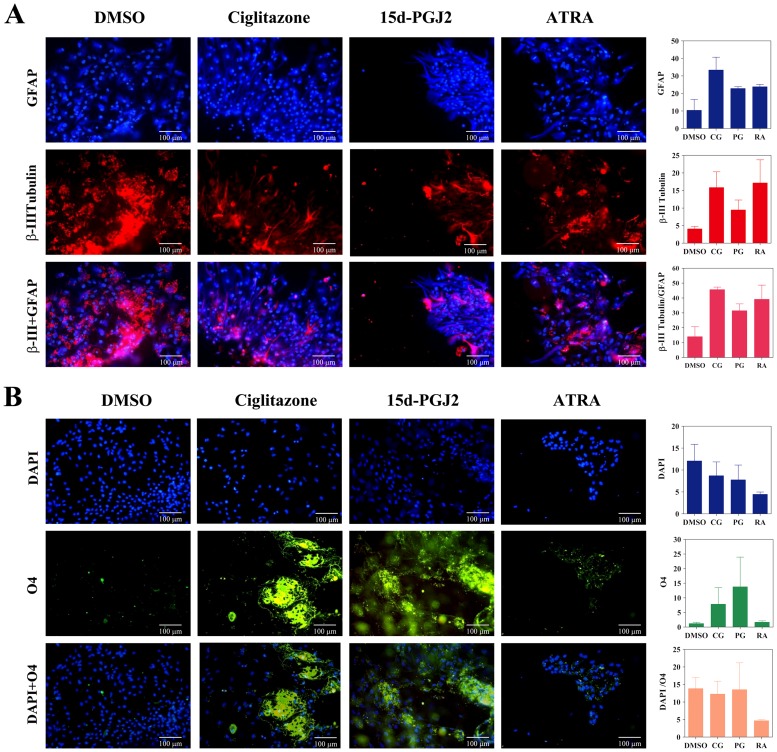
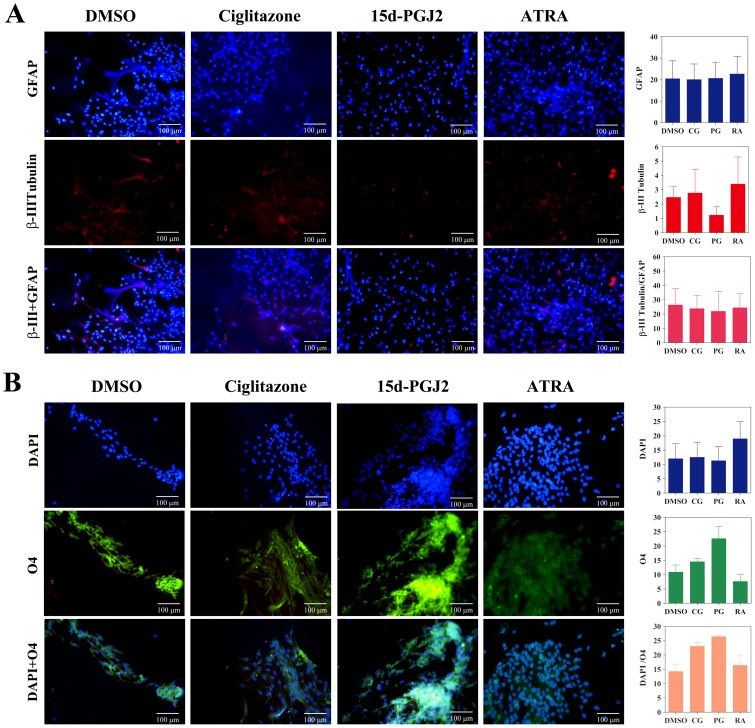
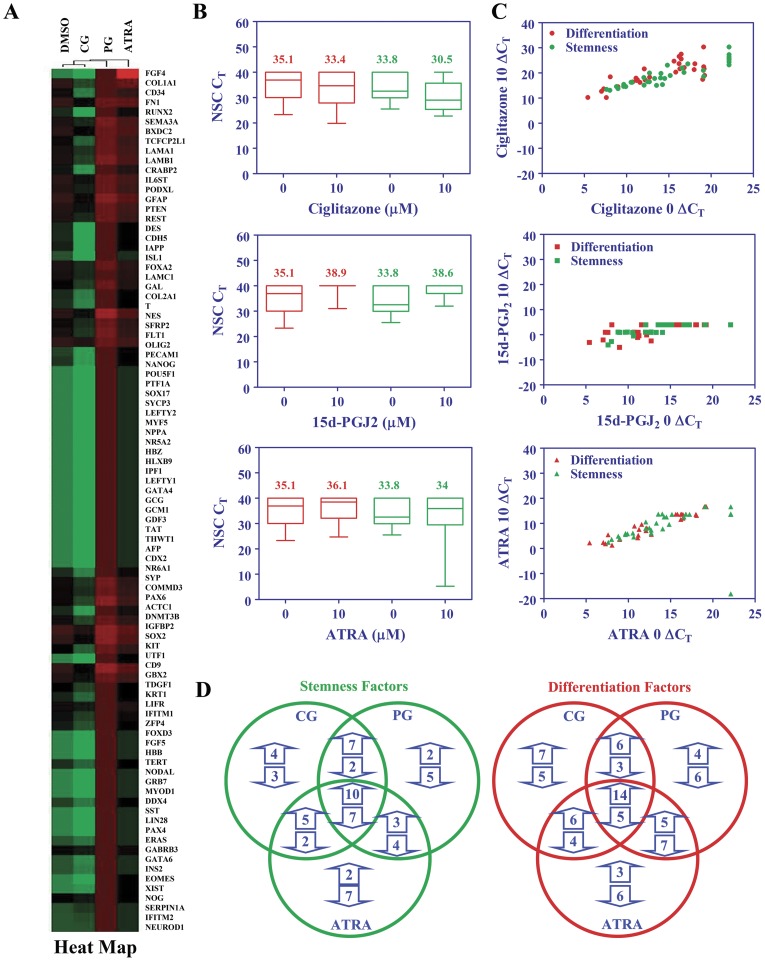
Neural stem cells (NSCs) are a small population of resident cells that can grow, migrate and differentiate into neuro-glial cells in the central nervous system (CNS). Peroxisome proliferator-activated receptor gamma (PPARγ) is a nuclear receptor transcription factor that regulates cell growth and differentiation. In this study we analyzed the influence of PPARγ agonists on neural stem cell growth and differentiation in culture. We found that in vitro culture of mouse NSCs in neurobasal medium with B27 in the presence of epidermal growth factor (EGF) and basic fibroblast growth factor (bFGF) induced their growth and expansion as neurospheres. Addition of all-trans retinoic acid (ATRA) and PPARγ agonist ciglitazone or 15-Deoxy-Δ(12,14)-Prostaglandin J(2) (15d-PGJ2) resulted in a dose-dependent inhibition of cell viability and proliferation of NSCs in culture. Interestingly, NSCs cultured with PPARγ agonists, but not ATRA, showed significant increase in oligodendrocyte precursor-specific O4 and NG2 reactivity with a reduction in NSC marker nestin, in 3-7 days. In vitro treatment with PPARγ agonists and ATRA also induced modest increase in the expression of neuronal β-III tubulin and astrocyte-specific GFAP in NSCs in 3-7 days. Further analyses showed that PPARγ agonists and ATRA induced significant alterations in the expression of many stemness and differentiation genes associated with neuro-glial differentiation in NSCs. These findings highlight the influence of PPARγ agonists in promoting neuro-glial differentiation of NSCs and its significance in the treatment of neurodegenerative diseases.


Conflict of interest statement

Competing Interests: The authors have declared that no competing interests exist.

Figures

Figure 1
Figure 1. EGF+bFGF induce expansion of NSCs as neurospheres in culture.
Brain cells isolated from newborn mice were cultured in 12 well tissue culture plates in NBM+B27 with EGF+bFGF. Neurospheres formed in 7–10 days were photographed under microscope (100×) (A). Neurospheres attach and spread after 10 days in culture (200×) (B). NSCs dissociated from 10 day old neurospheres (200×) (C) were cultured in 96 well tissue culture plates (1×10⁴/0.2 ml/well) and the proliferation was measured by 3H thymidine uptake assay (D). Values are means of triplicates±SD and the p values are expressed as *(p<0.05), **(p<0.01) and ***(p<0.001). The figure is a representative of three independent experiments.
Figure 2
Figure 2. Inhibition of NSC proliferation by PPARγ agonists.
NSCs dissociated from 7–10 day old neurospheres were cultured in 96 well tissue culture plates (1×10⁴/0.2 ml/well) in NBM+B27 with different doses of EGF+bFGF (A) or 10 ng/ml EGF+bFGF in the presence of different doses of 15d-PGJ2 (B), ciglitazone (C) and ATRA (D). The cell proliferation/viability was measured by WST-1 assay. The values are means of triplicates±SD and the p values are expressed as *(p<0.05), **(p<0.01), and ***(p<0.001). The figure is a representative of three independent experiments.
Figure 3
Figure 3. Modulation of stem cell and differentiation markers by PPARγ agonists in NSCs.
NSCs were cultured in NBM+B27 with EGF+bFGF in the presence of 0, 1 and 5 µM ciglitazone, 15d-PGJ2 or ATRA at 37°C for 72 h. The expression of βIII tubulin, GFAP (A), NG2, Nestin (B), MBP, MOG (C) and β-Actin was analyzed by Western blot and ECL detection system. Mouse brain extract was used as positive control (C). The relative quantities of protein bands normalized to β-Actin in the blots were determined by densitometry and presented as histograms. The values are mean±SD and the p values are expressed as *(p<0.05), **(p<0.01), and ***(p<0.001). The figure is a representative of five independent experiments.
Figure 4
Figure 4. PPARγ agonists induce the expression of oligodendrocyte markers in three days in NSCs.
Neurospheres were cultured in poly-D-lysine coated 8 well chamber slides in NBM+B27 with 10 ng/ml EGF+bFGF in the presence of 0 (DMSO) or 1 µM ciglitazone, 15d-PGJ2 or ATRA. After 3 days the cells were stained with GFAP, βIII tubulin, and O4 antibodies along with DAPI and photographed (200×) under fluorescence microscope. The figure is a representative of three independent experiments. The values are mean±SEM and the p values are expressed as *(p<0.05), **(p<0.01), and ***(p<0.001). The figure is a representative of three independent experiments.
Figure 5
Figure 5. PPARγ agonists induce the expression of oligodendrocyte markers in seven days in NSCs.
Neurospheres were cultured in poly-D-lysine coated 8 well chamber slides in NBM+B27 with 10 ng/ml EGF+bFGF in the presence of 0 (DMSO) or 1 µM ciglitazone, 15d-PGJ2 or ATRA. After 7 days the cells were stained with GFAP, βIII tubulin, and O4 antibodies along with DAPI and photographed (200×) under fluorescence microscope. The values are mean±SEM and the p values are expressed as *(p<0.05), **(p<0.01), and ***(p<0.001). The figure is a representative of three independent experiments.
Figure 6
Figure 6. Regulation of stemness and differentiation genes by PPARγ agonists in NSCs.
NSCs were cultured in NBM+B27 with 10 ng/ml EGF+bFGF in the presence of 0 or 1 µM ciglitazone, 15d-PGJ2 or ATRA for 3 days and the stem cell gene expression analyzed by qRT-PCR. (A) Heat map showing the expression levels of stemness and differentiation genes in NSCs treated with agonists compared to control. (B) Box plots showing the CT values of differentiation (Red) and stemness (Green) genes in NSCs treated with agonists compared to control. (C) Scatter plots showing ΔCT values of differentiation (Red) and stemness (Green) genes in NSCs treated with agonists compared to control. (D) Number of stemness and differentiation genes altered is presented as Venn diagram. The figure is representative of two independent experiments.

Similar articles

Cited by

References

    1. Miller FD, Gauthier AS (2007) Timing is everything: making neurons versus glia in the developing cortex. Neuron 54: 357–369. - PubMed
    1. Weiss S, Reynolds BA, Vescovi AL, Morshead C, Craig CG, et al. (1996) Is there a neural stem cell in the mammalian forebrain? Trends Neurosci 19: 387–393. - PubMed
    1. Gage FH (2000) Mammalian neural stem cells. Science 287: 1433–1438. - PubMed
    1. Eriksson PS, Perfilieva E, Bjork-Eriksson T, Alborn AM, Nordborg C, et al. (1998) Neurogenesis in the adult human hippocampus. Nat Med 4: 1313–1317. - PubMed
    1. Gage FH (1998) Stem cells of the central nervous system. Curr Opin Neurobiol 8: 671–676. - PubMed

MeSH terms