

The mechanism of mTOR (mammalian target of rapamycin) in a mouse model of polycystic ovary syndrome (PCOS)
- PMID: 23185989
- PMCID: PMC3538528
- DOI: 10.1186/1757-2215-5-38
The mechanism of mTOR (mammalian target of rapamycin) in a mouse model of polycystic ovary syndrome (PCOS)
Abstract
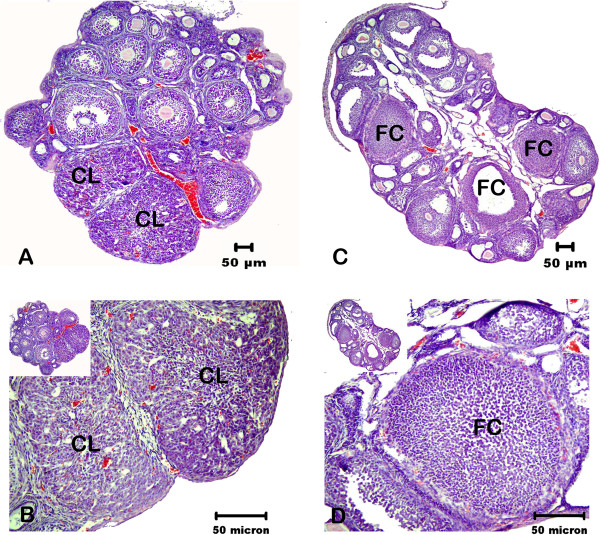
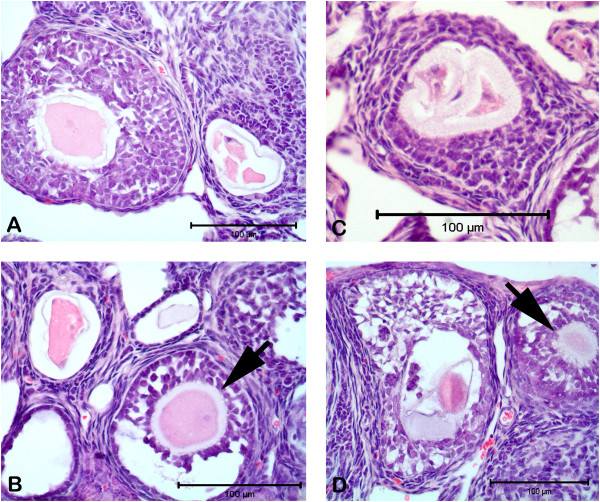
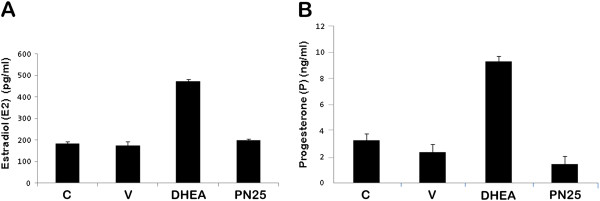
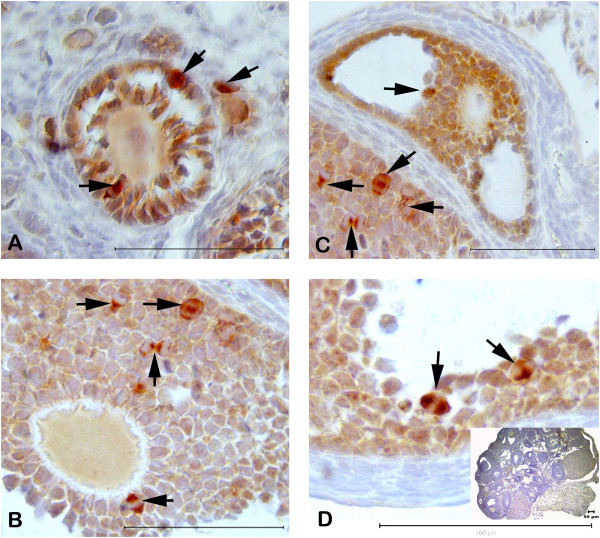
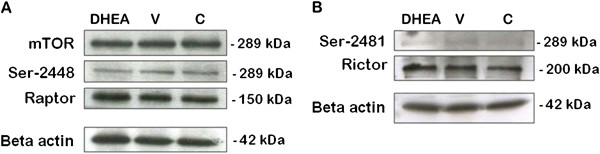
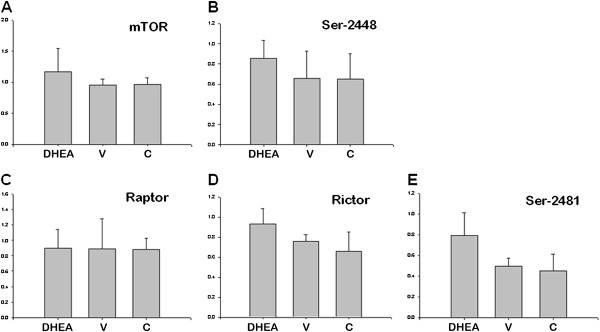
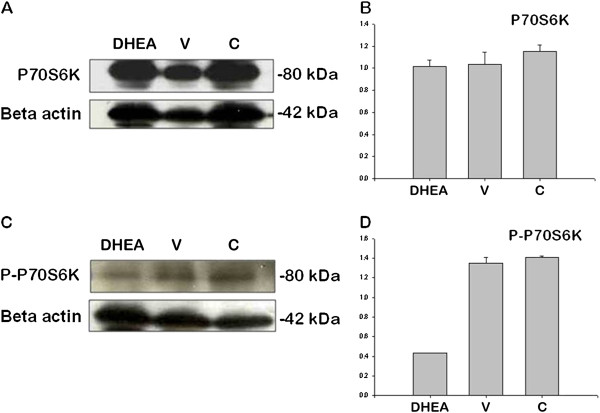
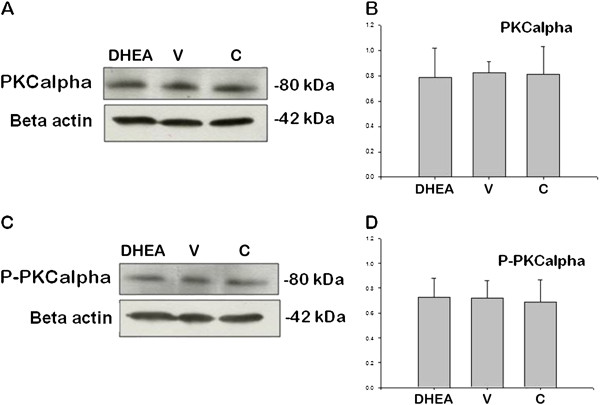
Polycystic ovary syndrome (PCOS) is a common and complex endocrine disorder affecting 5-10% of women in reproductive age that is characterized by hyperandrogenism, oligo- or anovulation and infertility. However the pathophysiology of PCOS still remains unknown. The mammalian target of rapamycin (mTOR) is a central component that regulates various processes including cell growth, proliferation, metabolism, and angiogenesis. mTOR signaling cascade has recently been examined in ovarian follicles where it regulates granulosa cell proliferation and differentiation. mTOR functions as two complexes, mTOR complex 1 and 2. Therefore, we hypothesized that mTORC1 and/or 2 may have important role in proliferation of theca and granulosa cells in PCOS. In the present study, we sought to determine the mTOR signaling pathway in PCOS mouse ovary. We designed 3 groups: Control (C, no treatment), PCOS (P, The injection of DHEA (6 mg/100 g BW in 0.1 ml of sesame oil) (s.c) for 20 consecutive days), Vehicle (V, daily (s.c) sesame oil alone injection). Our results showed that mTORC1 and mTORC2-mediated signaling may play a role in PCOS mouse ovary. These findings provide evidence that mTORC1 and mTORC2 may have responsibility in increased ovarian follicular cell proliferation and growth in PCOS. Consequently, these results suggest that the mTOR signaling pathways (mTORC1 and mTORC 2) may create new clinical strategies to optimize developmental competence of PCOS should target correction of the entire follicle growth, oocyte development process and anovulatory infertility in PCOS.
Figures
Similar articles
-
The effect of rapamycin treatment on mouse ovarian follicle development in dehydroepiandrosterone-induced polycystic ovary syndrome mouse model.Zygote. 2024 Oct;32(5):386-395. doi: 10.1017/S0967199424000388. Epub 2024 Nov 5. Zygote. 2024. PMID: 39498504
-
AMERICAN ASSOCIATION OF CLINICAL ENDOCRINOLOGISTS, AMERICAN COLLEGE OF ENDOCRINOLOGY, AND ANDROGEN EXCESS AND PCOS SOCIETY DISEASE STATE CLINICAL REVIEW: GUIDE TO THE BEST PRACTICES IN THE EVALUATION AND TREATMENT OF POLYCYSTIC OVARY SYNDROME--PART 1.Endocr Pract. 2015 Nov;21(11):1291-300. doi: 10.4158/EP15748.DSC. Endocr Pract. 2015. PMID: 26509855
-
Significance of pro-angiogenic estrogen metabolites in normal follicular development and follicular growth arrest in polycystic ovary syndrome.Hum Reprod. 2020 Jul 1;35(7):1655-1665. doi: 10.1093/humrep/deaa098. Hum Reprod. 2020. PMID: 32558920 Free PMC article.
-
Molecular Mechanisms of Laparoscopic Ovarian Drilling and Its Therapeutic Effects in Polycystic Ovary Syndrome.Int J Mol Sci. 2020 Oct 31;21(21):8147. doi: 10.3390/ijms21218147. Int J Mol Sci. 2020. PMID: 33142702 Free PMC article. Review.
-
Polycystic Ovary Syndrome.Obstet Gynecol. 2018 Aug;132(2):321-336. doi: 10.1097/AOG.0000000000002698. Obstet Gynecol. 2018. PMID: 29995717 Review.
Cited by
-
Astragaloside IV regulates autophagy-mediated proliferation and apoptosis in a rat model of PCOS by activating the PPARγ pathway.Iran J Basic Med Sci. 2022 Jul;25(7):882-889. doi: 10.22038/IJBMS.2022.64475.14179. Iran J Basic Med Sci. 2022. PMID: 36033957 Free PMC article.
-
Phosphatidylinositide 3-kinase inhibition: A new potential target for the treatment of polycystic ovarian syndrome.Pharm Biol. 2016;54(6):975-83. doi: 10.3109/13880209.2015.1091482. Epub 2015 Oct 12. Pharm Biol. 2016. PMID: 26459667 Free PMC article.
-
Consecutive Low Doses of Streptozotocin Induce Polycystic Ovary Syndrome Features in Mice.Int J Mol Sci. 2021 Jan 28;22(3):1299. doi: 10.3390/ijms22031299. Int J Mol Sci. 2021. PMID: 33525535 Free PMC article.
-
Comparative Transcriptomic Analysis of the Pituitary Gland between Cattle Breeds Differing in Growth: Yunling Cattle and Leiqiong Cattle.Animals (Basel). 2020 Jul 25;10(8):1271. doi: 10.3390/ani10081271. Animals (Basel). 2020. PMID: 32722439 Free PMC article.
-
Melatonin Signaling Pathways Implicated in Metabolic Processes in Human Granulosa Cells (KGN).Int J Mol Sci. 2022 Mar 10;23(6):2988. doi: 10.3390/ijms23062988. Int J Mol Sci. 2022. PMID: 35328408 Free PMC article.
References
-
- Burger CW, Korsen T, van Kessel H, van Dop PA, Caron FJ, Schoemaker J. Pulsatile luteinizing hormone patterns in the follicular phase of the menstrual cycle, polycystic ovarian disease (PCOD) and non-PCOD secondary amenorrhea. J Clin Endocrinol Metab. 1985;61:1126–1132. doi: 10.1210/jcem-61-6-1126. - DOI - PubMed
LinkOut - more resources
Full Text Sources
Molecular Biology Databases
Miscellaneous
