. 2012 Dec;122(12):4654-66.
doi: 10.1172/JCI63375. Epub 2012 Nov 26.

Tranexamic acid concentrations associated with human seizures inhibit glycine receptors

Affiliations

Tranexamic acid concentrations associated with human seizures inhibit glycine receptors

Irene Lecker et al. J Clin Invest. 2012 Dec.

Abstract

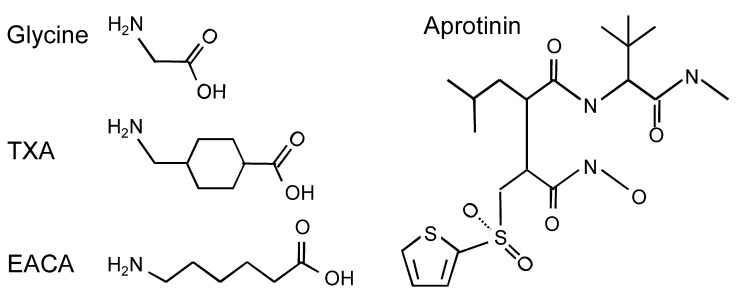
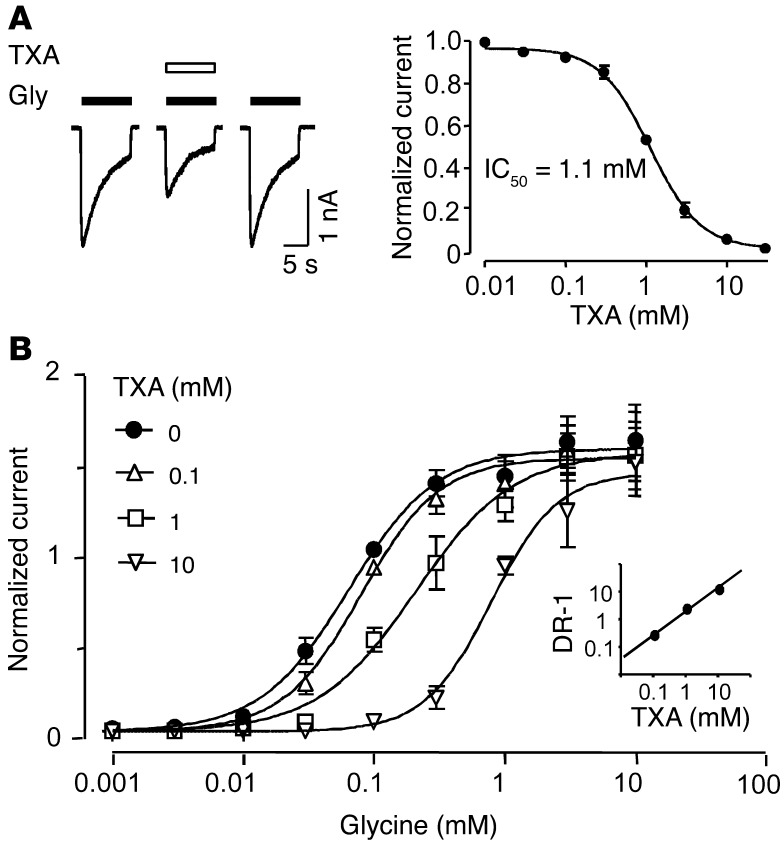
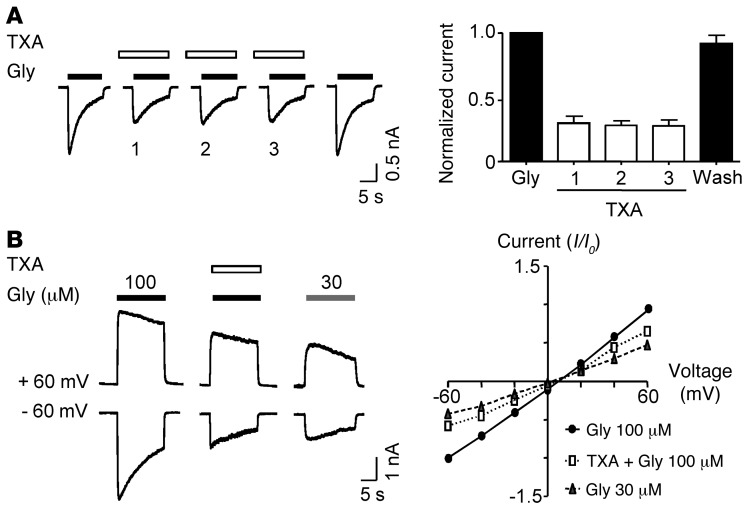
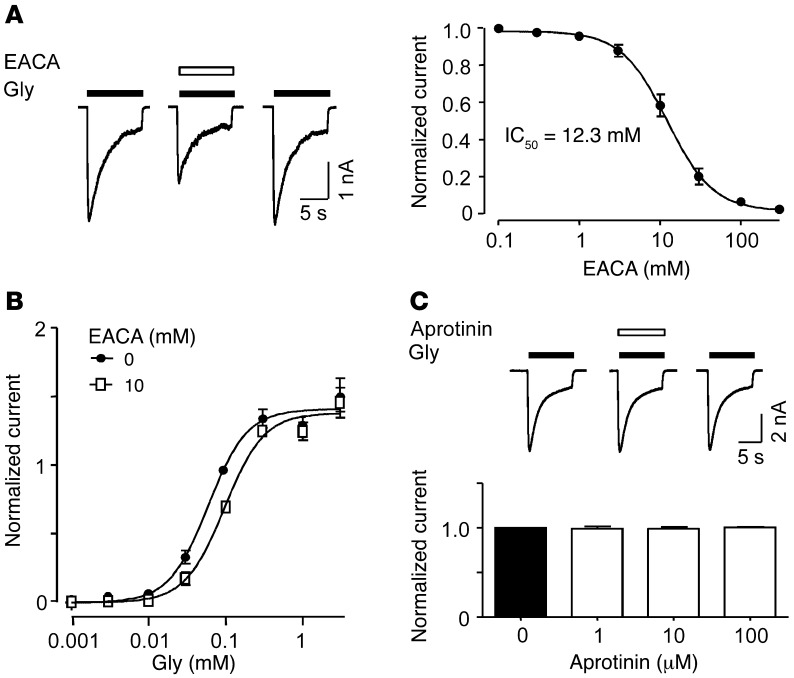
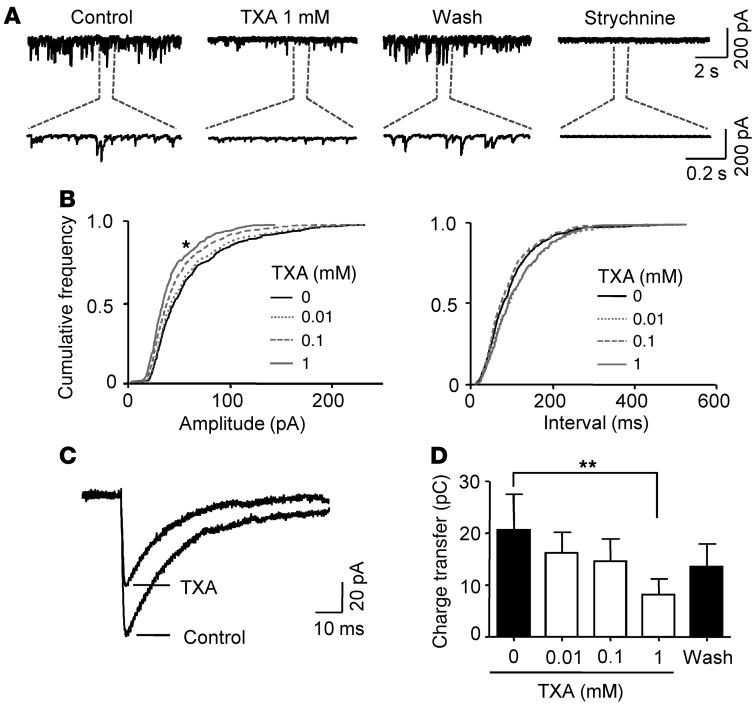
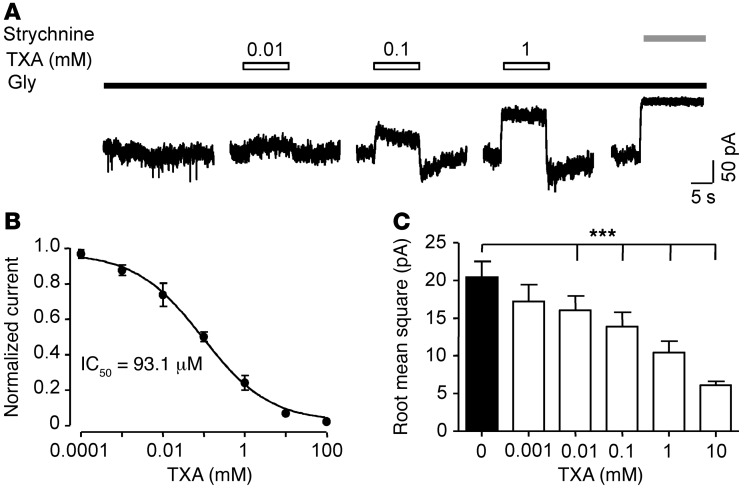
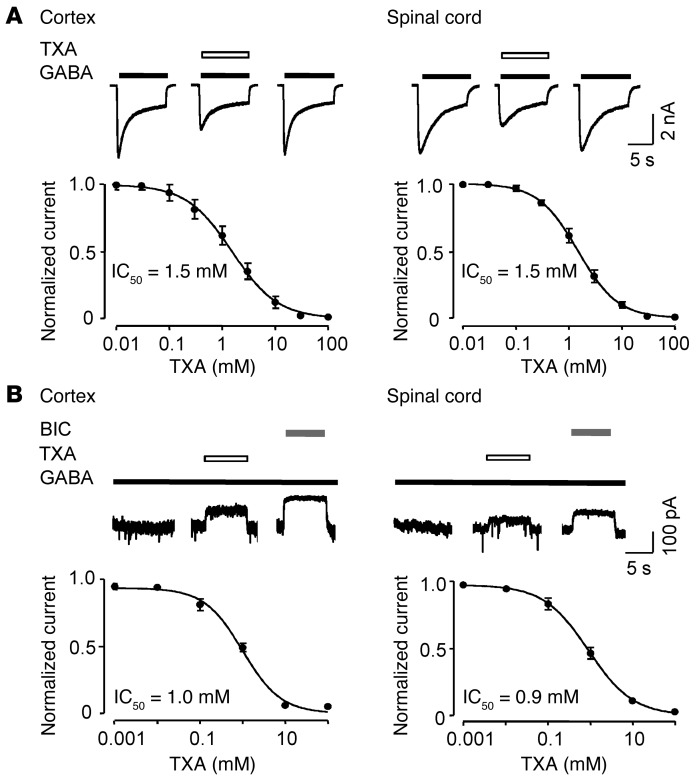
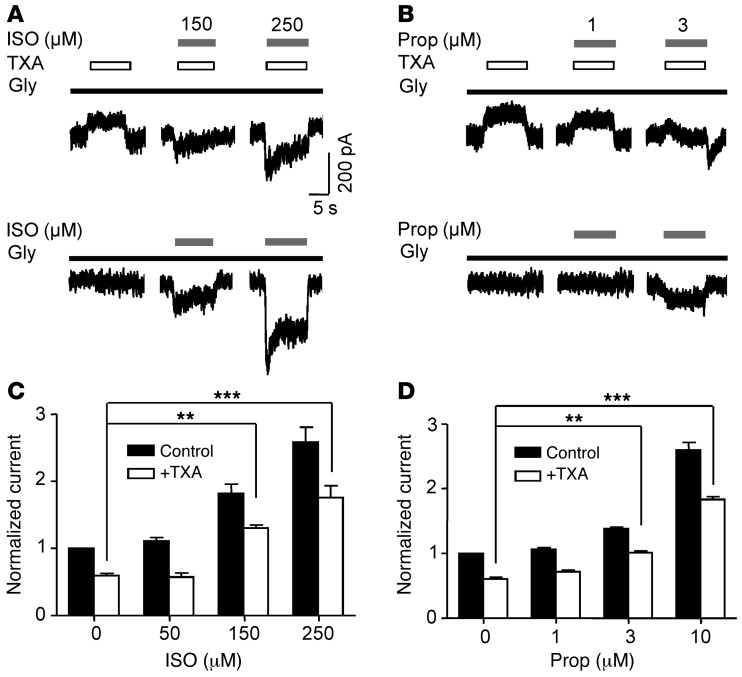
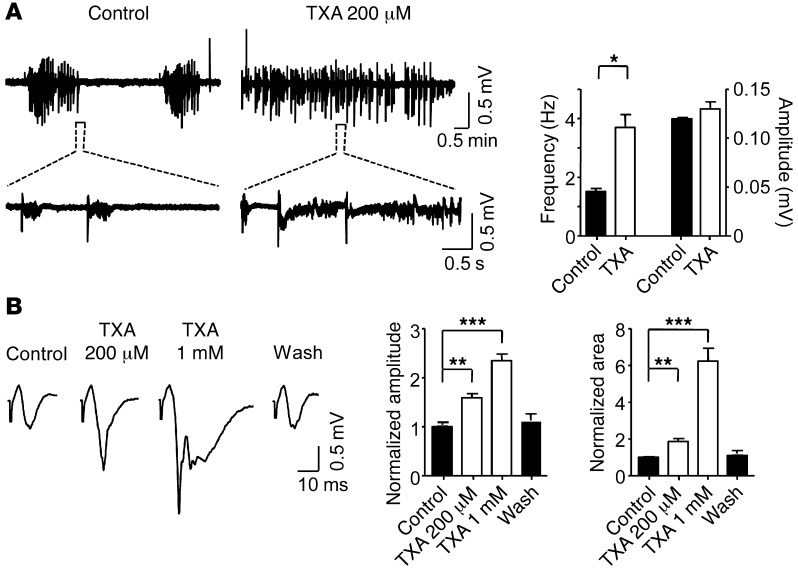
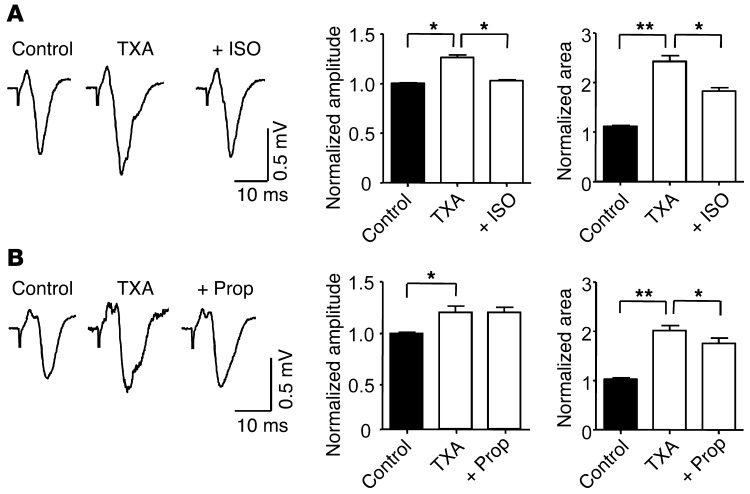
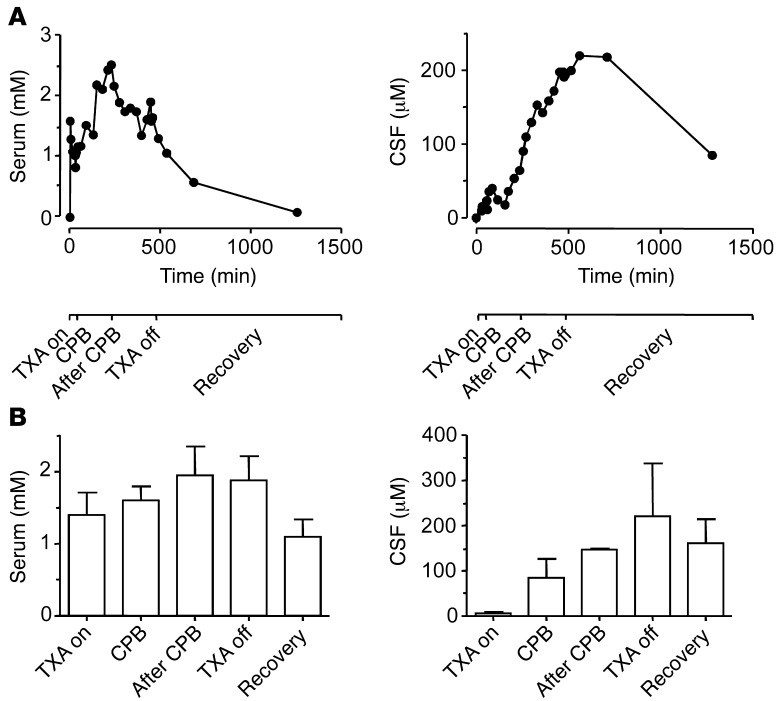
Antifibrinolytic drugs are widely used to reduce blood loss during surgery. One serious adverse effect of these drugs is convulsive seizures; however, the mechanisms underlying such seizures remain poorly understood. The antifibrinolytic drugs tranexamic acid (TXA) and ε-aminocaproic acid (EACA) are structurally similar to the inhibitory neurotransmitter glycine. Since reduced function of glycine receptors causes seizures, we hypothesized that TXA and EACA inhibit the activity of glycine receptors. Here we demonstrate that TXA and EACA are competitive antagonists of glycine receptors in mice. We also showed that the general anesthetic isoflurane, and to a lesser extent propofol, reverses TXA inhibition of glycine receptor-mediated current, suggesting that these drugs could potentially be used to treat TXA-induced seizures. Finally, we measured the concentration of TXA in the cerebrospinal fluid (CSF) of patients undergoing major cardiovascular surgery. Surprisingly, peak TXA concentration in the CSF occurred after termination of drug infusion and in one patient coincided with the onset of seizures. Collectively, these results show that concentrations of TXA equivalent to those measured in the CSF of patients inhibited glycine receptors. Furthermore, isoflurane or propofol may prevent or reverse TXA-induced seizures.


Figures

Figure 1
Figure 1. Molecular structures of glycine and the antifibrinolytic drugs TXA, EACA, and aprotinin.
Figure 2
Figure 2. TXA is a competitive antagonist of glycine receptors.
(A) TXA (1 mM) inhibits glycine (100 μM)–activated currents in cortical neurons. The corresponding concentration-response plot shows IC50 = 1.1 ± 0.1 mM (n = 6–8). Here, and in subsequent figures, pA and nA stand for picoamperes and nanoamperes, respectively. (B) Concentration-response plots for glycine current recorded in the absence and presence of TXA. All values were normalized to currents evoked by glycine (100 μM). The EC50 values and Hill coefficients for TXA (0, 0.1, 1, 10 mM) were 0.094 ± 0.007 mM and 1.4 ± 0.2; 0.079 ± 0.009 mM and 1.4 ± 0.2; 0.21 ± 0.038 mM and 1.2 ± 0.2; and 0.79 ± 0.013 mM and 1.7 ± 0.4, respectively (n = 6–7). The Schild plot (inset) was generated by calculating the dose-response ratios (DR-1) of the EC50 of TXA divided by the EC50 of glycine for each concentration of TXA. The plot is consistent with a slope near 1 (r2 = 0.81) and a dissociation constant of 0.73 mM. Data are mean ± SEM.
Figure 3
Figure 3. TXA inhibition of glycine receptors is not use or voltage dependent.
(A) Repeated application of TXA (1 mM) does not cause an increasing block of glycine (100 μM)–evoked currents. The bar graph shows mean peak amplitude of the current recorded with and without coapplication of TXA. Current recorded during the sequential application of TXA is identified in the bars as 1, 2, and 3 (n = 6). (B) Currents evoked by glycine (100 and 30 μM) in the absence and presence of TXA (1 mM) were recorded at two holding potentials. The current-voltage plot shows that TXA causes an outward rectification of glycine (100 μM) current-voltage plot and that glycine (30 μM) produced a similar modest outward rectification (n = 5–6). All values were normalized to glycine current activated by 100 μM at –60 mV. Data are mean ± SEM.
Figure 4
Figure 4. EACA competitively inhibits glycine receptors, whereas aprotinin does not.
(A) Inhibition of glycine (100 μM)–activated current by EACA (10 mM) in cortical neurons. The corresponding concentration-response plot shows IC50 = 12.3 ± 0.9 mM (n = 5–6). (B) Plots for current recorded in the absence and presence of EACA (10 mM) show a rightward shift in the presence of EACA. The EC50 values and Hill coefficients for EACA were 134.1 ± 4.7 μM and 1.7 ± 0.2, respectively (n = 5–6). All values were normalized to currents evoked by glycine (100 μM). (C) Aprotinin (100 μM) has no effect on glycine (100 μM)–evoked current in cortical neurons. The graph shows that aprotinin (1–100 μM) failed to inhibit glycine-evoked current (n = 5). Data are mean ± SEM.
Figure 5
Figure 5. TXA inhibits glycinergic mIPSCs at higher concentrations.
(A) Glycinergic mIPSCs recorded from a spinal cord neuron, in the absence and presence of TXA. Application of strychnine abolished all glycinergic mIPSCs. pC stands for picocoloumbs. (B) Cumulative frequency plots for mIPSCs show the effect of TXA on the amplitude and inter-event interval. TXA (1 mM) significantly decreased the amplitude of the mIPSCs (left panel) without affecting the inter-event interval (right panel). (C) Average traces from 100 individual mIPSCs before and after application of TXA (1 mM). Data for AC were obtained from the same spinal cord neuron. (D) TXA (1 mM) significantly decreased charge transfer of glycinergic mIPSCs, whereas lower concentrations had no significant effect (n = 5). *P < 0.05, **P < 0.01 versus 0 TXA. Data are mean ± SEM.
Figure 6
Figure 6. TXA, at clinical concentrations, inhibits current evoked by low concentrations of glycine.
(A) Inhibition of glycine (10 μM) currents by TXA (0.01–1 mM) in a spinal cord neuron. Application of strychnine (1 μM) completely inhibited the glycine current. (B) Concentration-response plot for TXA-mediated inhibition of glycine current in spinal cord neurons shows IC50 = 93.1 ± 2.7 μM (n = 6). (C) Analysis of the effect of TXA on noise shows that TXA (0.01–10 mM) significantly reduces receptor activity (n = 5–7). ***P < 0.001 versus 0 TXA. Data are mean ± SEM.
Figure 7
Figure 7. TXA inhibits currents evoked by high and low concentrations of GABA in cortical and spinal cord neurons.
(A) TXA (1 mM) inhibits currents evoked by high (EC50) concentrations of GABA in cortical neurons (20 μM) and spinal cord neurons (25 μM). The corresponding concentration-response plots show IC50 = 1.5 ± 0.1 mM (n = 4–6) in both the cortex and the spinal cord. (B) TXA (1 mM) also inhibits currents evoked by low concentrations of GABA (1 μM) in cortical and spinal cord neurons. The corresponding concentration-response plots show IC50 = 1.0 ± 0.1 mM (n = 5–7) in the cortex and IC50 = 0.9 ± 0.1 mM (n = 5–7) in the spinal cord. Application of bicuculline (BIC, 100 μM) completely inhibited GABA current. Data are mean ± SEM.
Figure 8
Figure 8. Isoflurane and propofol attenuate TXA inhibition of current evoked by a low concentration of glycine.
(A and B) The effects of isoflurane (ISO, 150 and 250 μM) and propofol (Prop, 1 and 3 μM) on current evoked by glycine (10 μM) in the presence and absence of TXA (0.1 mM). (C and D) Isoflurane (150 and 250 μM) and propofol (3 and 10 μM) attenuated TXA-mediated inhibition of glycine current (n = 6–7). In the absence of TXA, isoflurane (150 and 250 μM) increased current amplitude to 182.2% ± 13.8% and 258.7 ± 21.8% of control, respectively. Similarly, in the absence of TXA, propofol (3 and 10 μM) increased current amplitude to 138.0% ± 2.6% and 260.1% ± 11.2% of control, respectively (n = 6–7). Lower concentrations of isoflurane (50 μM) or propofol (1 μM) had no effect on current amplitude. **P < 0.01, ***P < 0.001 versus control. Data are mean ± SEM.
Figure 9
Figure 9. TXA enhances SLEs and evoked field potentials in cortical slices.
(A) SLEs recorded with 0 Mg in the extracellular fluid, in the absence and presence of TXA (200 μM). The bar graph shows that TXA increases the frequency but not the amplitude (control: 0.12 ± 0.001 mV, TXA: 0.13 ± 0.007 mV) of the SLEs (n = 4). (B) Evoked field potentials recorded in regular ACSF in the absence and presence of TXA (200 μM and 1 mM). The graphs show that both concentrations of TXA significantly increase the amplitude and the area of the evoked field responses (n = 6). *P < 0.05, **P < 0.01, ***P < 0.001 versus control. Data are mean ± SEM.
Figure 10
Figure 10. Isoflurane and propofol attenuate the enhancing effects of TXA on evoked field potentials in cortical slices.
(A) Coapplication of isoflurane (250 μM) with TXA (200 μM) reverses the effect of TXA on evoked field responses. The bar graphs show that isoflurane reverses the effect on amplitude and attenuates the effect on area of evoked field responses (n = 5). (B) Coapplication of propofol (1 μM) and TXA (200 μM) also attenuates the effect of TXA on the evoked field responses. The bar graphs show that propofol attenuates the enhancing effect on area but fails to reverse the effect on amplitude (n = 5). *P < 0.05, **P < 0.01 versus TXA. Data are mean ± SEM.
Figure 11
Figure 11. TXA concentrations measured in the serum and CSF of patients who underwent cardiopulmonary bypass and major vascular surgery.
(A) Time-dependent plot of TXA concentration in the serum and CSF of one patient. The timeline at the bottom of the figure represents key surgical events. (B) Average TXA concentration in the serum and CSF during key surgical events (n = 4). Data are mean ± SEM.

Comment in

  • Understanding the TXA seizure connection.
    Schwinn DA, Mackensen GB, Brown EN. Schwinn DA, et al. J Clin Invest. 2012 Dec;122(12):4339-41. doi: 10.1172/JCI66724. Epub 2012 Nov 26. J Clin Invest. 2012. PMID: 23187134 Free PMC article.

References

    1. Shakur H, et al. Effects of tranexamic acid on death, vascular occlusive events, and blood transfusion in trauma patients with significant haemorrhage (CRASH-2): a randomised, placebo-controlled trial. Lancet. 2010;376(9734):23–32. doi: 10.1016/S0140-6736(10)60835-5. - DOI - PubMed
    1. Zufferey PJ, et al. Tranexamic acid in hip fracture surgery: a randomized controlled trial. Br J Anaesth. 2010;104(1):23–30. doi: 10.1093/bja/aep314. - DOI - PubMed
    1. Rannikko A, Petas A, Taari K. Tranexamic acid in control of primary hemorrhage during transurethral prostatectomy. Urology. 2004;64(5):955–958. doi: 10.1016/j.urology.2004.07.008. - DOI - PubMed
    1. Neilipovitz DT. Tranexamic acid for major spinal surgery. Eur Spine J. 2004;13(suppl 1):S62–S65. doi: 10.1007/s00586-004-0716-2. - DOI - PMC - PubMed
    1. Rahman Z, Hoque R, Ali A, Rahman M, Rahman MS. Blood conservation strategies for reducing peri-operative blood loss in open heart surgery. Mymensingh Med J. 2011;20(1):45–53. - PubMed

Publication types

MeSH terms