

Quantitative multi-color FRET measurements by Fourier lifetime excitation-emission matrix spectroscopy
- PMID: 23187535
- PMCID: PMC3601597
- DOI: 10.1364/OE.20.026806
Quantitative multi-color FRET measurements by Fourier lifetime excitation-emission matrix spectroscopy
Abstract
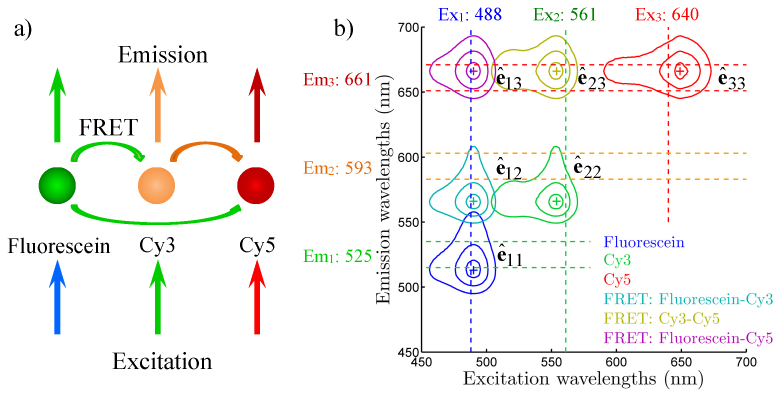
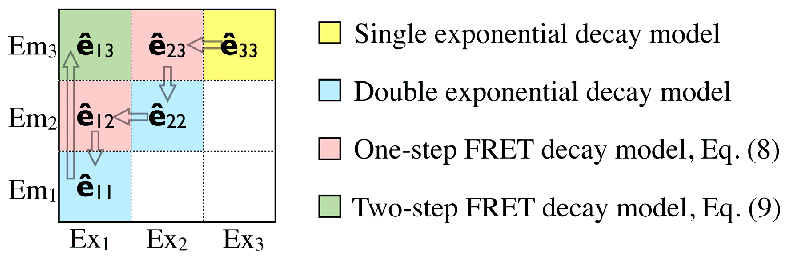
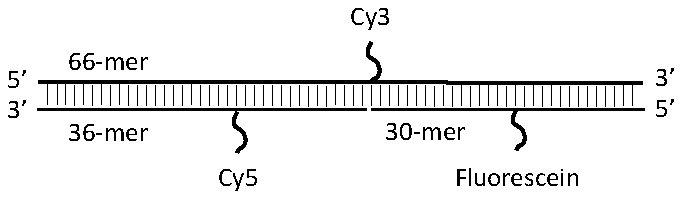
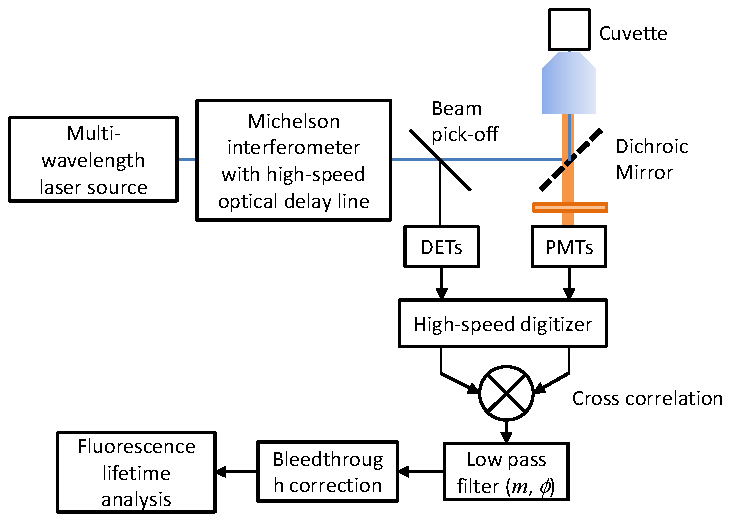
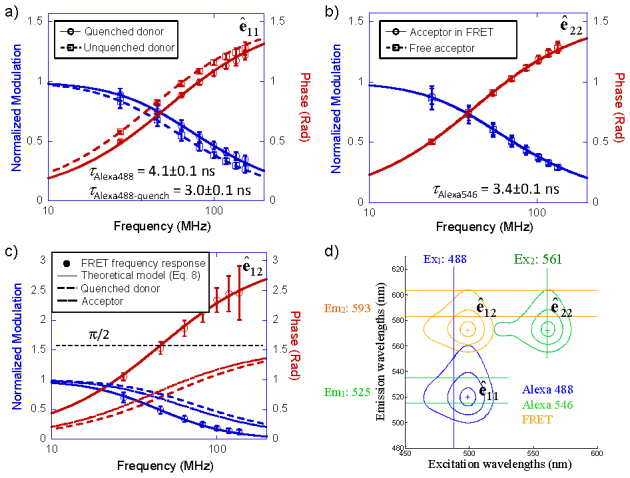
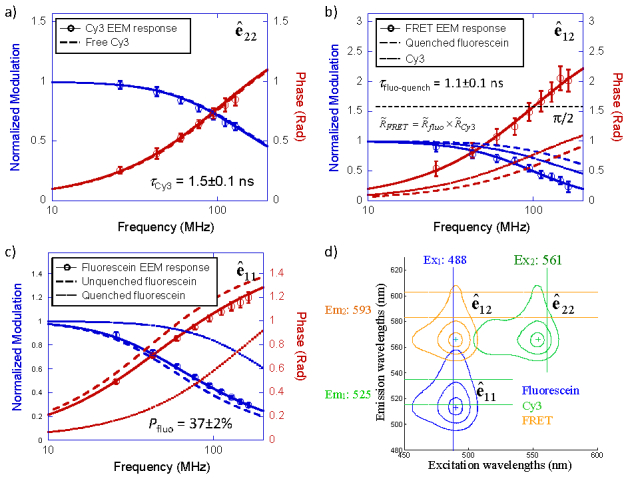
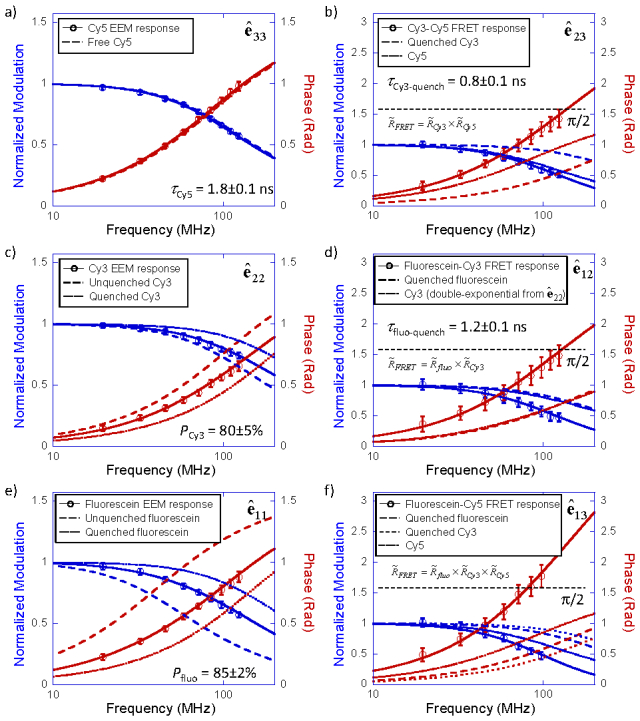
Förster resonant energy transfer (FRET) is extensively used to probe macromolecular interactions and conformation changes. The established FRET lifetime analysis method measures the FRET process through its effect on the donor lifetime. In this paper we present a method that directly probes the time-resolved FRET signal with frequency domain Fourier lifetime excitation-emission matrix (FLEEM) measurements. FLEEM separates fluorescent signals by their different phonon energy pathways from excitation to emission. The FRET process generates a unique signal channel that is initiated by donor excitation but ends with acceptor emission. Time-resolved analysis of the FRET EEM channel allows direct measurements on the FRET process, unaffected by free fluorophores that might be present in the sample. Together with time-resolved analysis on non-FRET channels, i.e. donor and acceptor EEM channels, time resolved EEM analysis allows precise quantification of FRET in the presence of free fluorophores. The method is extended to three-color FRET processes, where quantification with traditional methods remains challenging because of the significantly increased complexity in the three-way FRET interactions. We demonstrate the time-resolved EEM analysis method with quantification of three-color FRET in incompletely hybridized triple-labeled DNA oligonucleotides. Quantitative measurements of the three-color FRET process in triple-labeled dsDNA are obtained in the presence of free single-labeled ssDNA and double-labeled dsDNA. The results establish a quantification method for studying multi-color FRET between multiple macromolecules in biochemical equilibrium.
Figures
Similar articles
-
Quantitative FRET measurement by high-speed fluorescence excitation and emission spectrometer.Opt Express. 2010 Aug 30;18(18):18839-51. doi: 10.1364/OE.18.018839. Opt Express. 2010. PMID: 20940777
-
Modelling Förster resonance energy transfer (FRET) using anisotropy resolved multi-dimensional emission spectroscopy (ARMES).Biochim Biophys Acta Gen Subj. 2021 Feb;1865(2):129770. doi: 10.1016/j.bbagen.2020.129770. Epub 2020 Oct 22. Biochim Biophys Acta Gen Subj. 2021. PMID: 33214128
-
Multi-dimensional fluorescence lifetime and FRET measurements.Microsc Res Tech. 2007 May;70(5):442-51. doi: 10.1002/jemt.20431. Microsc Res Tech. 2007. PMID: 17393489
-
Detecting RNA/DNA hybridization using double-labeled donor probes with enhanced fluorescence resonance energy transfer signals.Methods Mol Biol. 2006;335:43-56. doi: 10.1385/1-59745-069-3:43. Methods Mol Biol. 2006. PMID: 16785619 Review.
-
Fluorescence resonance energy transfer (FRET) and competing processes in donor-acceptor substituted DNA strands: a comparative study of ensemble and single-molecule data.J Biotechnol. 2002 Jan;82(3):211-31. doi: 10.1016/s1389-0352(01)00039-3. J Biotechnol. 2002. PMID: 11999691 Review.
Cited by
-
Advancements and Applications of Conjugated Polyelectrolytes and Conjugated Oligoelectrolytes in Bioanalytical and Electrochemical Contexts.JACS Au. 2024 Dec 3;4(12):4592-4611. doi: 10.1021/jacsau.4c00789. eCollection 2024 Dec 23. JACS Au. 2024. PMID: 39735924 Free PMC article. Review.
-
Parallel excitation-emission multiplexed fluorescence lifetime confocal microscopy for live cell imaging.Opt Express. 2014 May 5;22(9):10221-32. doi: 10.1364/OE.22.010221. Opt Express. 2014. PMID: 24921725 Free PMC article.
-
FPGA-based multi-channel fluorescence lifetime analysis of Fourier multiplexed frequency-sweeping lifetime imaging.Opt Express. 2014 Sep 22;22(19):23073-85. doi: 10.1364/OE.22.023073. Opt Express. 2014. PMID: 25321778 Free PMC article.
-
Screening for protein-protein interactions using Förster resonance energy transfer (FRET) and fluorescence lifetime imaging microscopy (FLIM).Sci Rep. 2016 Jun 24;6:28186. doi: 10.1038/srep28186. Sci Rep. 2016. PMID: 27339025 Free PMC article.
-
Terminal lipophilization of a unique DNA dodecamer by various nucleolipid headgroups: Their incorporation into artificial lipid bilayers and hydrodynamic properties.Beilstein J Org Chem. 2015 Jun 1;11:913-29. doi: 10.3762/bjoc.11.103. eCollection 2015. Beilstein J Org Chem. 2015. PMID: 26124894 Free PMC article.
References
-
- Forster T., “Zwischenmolekulare energiewanderung und fluoreszenz,” Ann. Phys. (Berlin) 437(1-2), 55–75 (1948).10.1002/andp.19484370105 - DOI
-
- Kumar S., Alibhai D., Margineanu A., Laine R., Kennedy G., McGinty J., Warren S., Kelly D., Alexandrov Y., Munro I., Talbot C., Stuckey D. W., Kimberly C., Viellerobe B., Lacombe F., Lam E. W. F., Taylor H., Dallman M. J., Stamp G., Murray E. J., Stuhmeier F., Sardini A., Katan M., Elson D. S., Neil M. A. A., Dunsby C., French P. M. W., “FLIM FRET technology for drug discovery: automated multiwell-plate high-content analysis, multiplexed readouts and application in situ,” ChemPhysChem 12(3), 609–626 (2011).10.1002/cphc.201000874 - DOI - PMC - PubMed
Publication types
MeSH terms
Grants and funding
LinkOut - more resources
Full Text Sources
Other Literature Sources
