Extreme sensitivity of graphene photoconductivity to environmental gases
- PMID: 23187628
- PMCID: PMC3514499
- DOI: 10.1038/ncomms2235
Extreme sensitivity of graphene photoconductivity to environmental gases
Abstract
Graphene is a single layer of covalently bonded carbon atoms, which was discovered only 8 years ago and yet has already attracted intense research and commercial interest. Initial research focused on its remarkable electronic properties, such as the observation of massless Dirac fermions and the half-integer quantum Hall effect. Now graphene is finding application in touch-screen displays, as channels in high-frequency transistors and in graphene-based integrated circuits. The potential for using the unique properties of graphene in terahertz-frequency electronics is particularly exciting; however, initial experiments probing the terahertz-frequency response of graphene are only just emerging. Here we show that the photoconductivity of graphene at terahertz frequencies is dramatically altered by the adsorption of atmospheric gases, such as nitrogen and oxygen. Furthermore, we observe the signature of terahertz stimulated emission from gas-adsorbed graphene. Our findings highlight the importance of environmental conditions on the design and fabrication of high-speed, graphene-based devices.
Figures


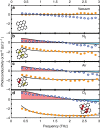
 )−1. The thicker contour in e represents Im(Δσ)=0, corresponding to the Lorentzian peak frequency, ω0. Measurements were performed in pure oxygen at room temperature and pressure.
 . From top to bottom: graphene in vacuum, N2, air and O2 at room temperature. Photo-induced absorption is observed in vacuum, but photo-induced bleaching is observed in gaseous environments. Inset: schematic representation of the pump–probe measurements of p-doped graphene (εF~0.3 eV) in vacuum (top) and in the presence of gases (bottom), with corresponding density of states (g(ε)). The high-energy pump (
 ) excites carriers far above the Dirac point, which cool by phonon emission. In gapless graphene, terahertz photons can be absorbed by the photoexcited carriers. In the presence of gases, stimulated emission releases extra terahertz photons, yielding a bleaching pump–probe signal.
References
-
- Novoselov K. S. et al. Electric field effect in atomically thin carbon films. Science 306, 666–669 (2004). - PubMed
-
- Novoselov K. S. et al. Two-dimensional gas of massless dirac fermions in graphene. Nature 438, 197–200 (2005). - PubMed
-
- Geim A. K. Graphene: status and prospects. Science 324, 1530–1534 (2009). - PubMed
-
- Bao Q., Loh K. P. Graphene photonics, plasmonics, and broad optoelectronic devices. ACS Nano 6, 3677–3694 (2012). - PubMed
-
- Bae S. et al. Roll-to-roll production of 30-inch graphene films for transparent electrodes. Nat. Nanotechnol. 5, 574–578 (2010). - PubMed
Publication types
LinkOut - more resources
Full Text Sources

