

Erythropoietin-induced erythroid precursor pool depletion causes erythropoietin hyporesponsiveness
- PMID: 23187865
- PMCID: PMC4032365
- DOI: 10.1007/s11095-012-0938-7
Erythropoietin-induced erythroid precursor pool depletion causes erythropoietin hyporesponsiveness
Abstract
Purpose: The purpose of this study is to demonstrate that the erythroid precursor depletion in bone marrow induced by recombinant human erythropoietin (rHuEPO) treatment may be another contributing factor to erythropoietin hyporesponsiveness.
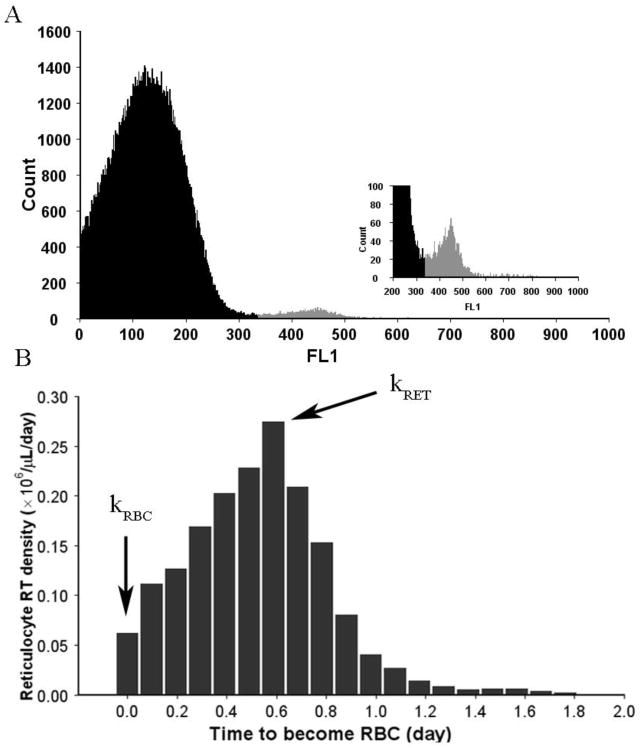
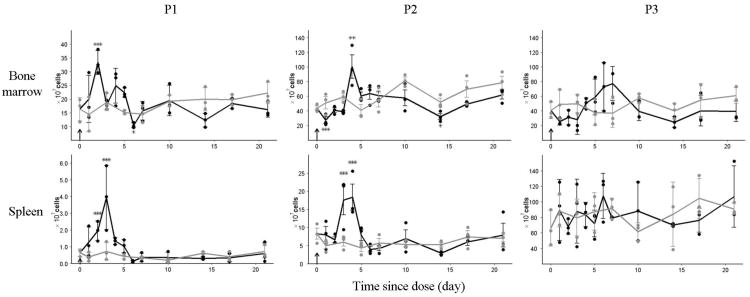
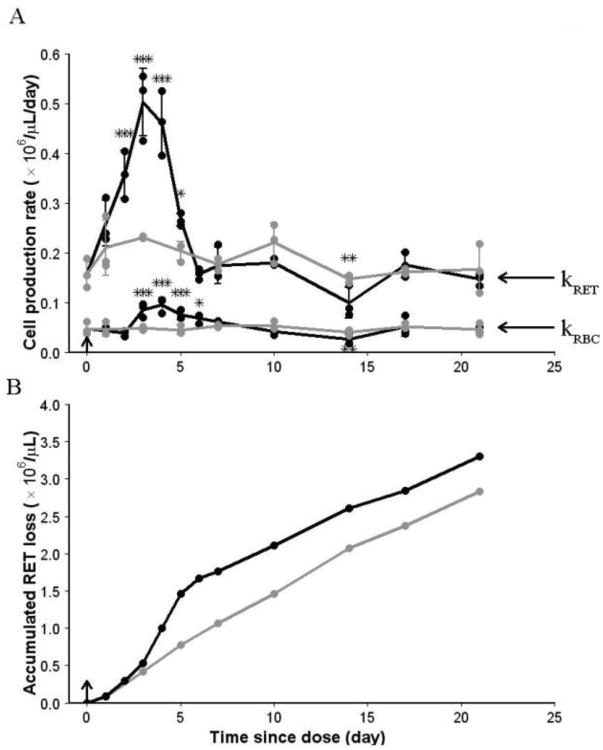
Methods: Healthy Wistar rats were given single dose (SD) or multiple doses (MD) of rHuEPO (100 IU/kg). In MD study, animals were challenged with thrice-weekly over two weeks. Blood, bone marrow and spleen (for SD only) were collected. The erythropoietic responses in bone marrow and spleen were quantified using a flow cytometric immunophenotyping technique. A mathematical approach involving measuring reticulocyte age distribution was developed to evaluate the reticulocyte loss due to neocytolysis.
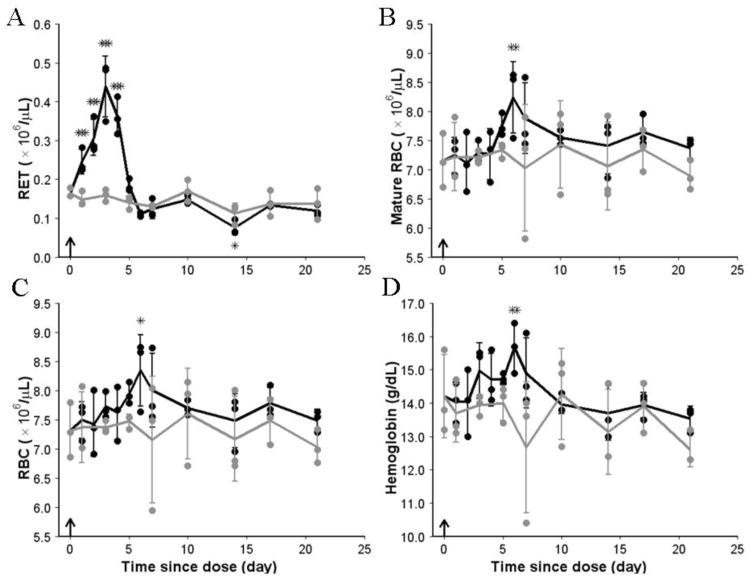
Results: A reduced level of erythropoietic responses below the baseline was observed for both MD and SD studies. In SD study, the reticulocyte decreased below the baseline after day 6. A depletion of the bone marrow erythroid precursor cells was observed. However, neocytolysis of reticulocyte only occurs from day 3-5 after rHuEPO injection.
Conclusions: The findings demonstrate that EPO-induced erythroid precursor depletion in bone marrow is responsible for reduced reticulocyte response and may contribute to erythropoietin hyporesponsiveness. Therefore, this study provides further justification for reducing the doses of erythropoietin-stimulating agents in anemic patients demonstrating hyporesponsiveness.
Figures


Similar articles
-
A quantitative systems pharmacology model of hyporesponsiveness to erythropoietin in rats.J Pharmacokinet Pharmacodyn. 2021 Oct;48(5):687-710. doi: 10.1007/s10928-021-09762-z. Epub 2021 Jun 7. J Pharmacokinet Pharmacodyn. 2021. PMID: 34100188
-
Cessation of intensive treatment with recombinant human erythropoietin is followed by secondary anemia.Blood. 2001 Jan 15;97(2):442-8. doi: 10.1182/blood.v97.2.442. Blood. 2001. PMID: 11154221
-
The quantification of reticulocyte maturation and neocytolysis in normal and erythropoietin stimulated rats.Biopharm Drug Dispos. 2014 Sep;35(6):330-40. doi: 10.1002/bdd.1902. Epub 2014 Jun 27. Biopharm Drug Dispos. 2014. PMID: 24888906
-
Cellular mechanism of resistance to erythropoietin.Nephrol Dial Transplant. 1995;10 Suppl 6:27-30. doi: 10.1093/ndt/10.supp6.27. Nephrol Dial Transplant. 1995. PMID: 8524490 Review.
-
Erythropoietin hyporesponsiveness: from iron deficiency to iron overload.Kidney Int Suppl. 1999 Mar;69:S107-18. Kidney Int Suppl. 1999. PMID: 10084294 Review.
Cited by
-
A Novel Combination Therapy of Erythropoietin and Thrombopoietin to Treat Erythropoietin-Resistance anemia.Pharm Res. 2022 Jun;39(6):1249-1265. doi: 10.1007/s11095-022-03304-z. Epub 2022 Jun 3. Pharm Res. 2022. PMID: 35661082
-
Mechanism-Based Pharmacokinetic/Pharmacodynamic Modeling of Erythroferrone in Anemic Rats with Chronic Kidney Disease and Chemotherapy-Induced Anemia: An Early Biomarker for Hemoglobin Response and rHuEPO Hyporesponsiveness.ACS Pharmacol Transl Sci. 2024 Dec 11;8(1):189-202. doi: 10.1021/acsptsci.4c00575. eCollection 2025 Jan 10. ACS Pharmacol Transl Sci. 2024. PMID: 39816799
-
Scaling Pharmacodynamics from Rats to Humans to Support Erythropoietin and Romiplostim Combination Therapy to Treat Erythropoietin-Resistant Anemia.Pharmaceutics. 2023 Jan 19;15(2):344. doi: 10.3390/pharmaceutics15020344. Pharmaceutics. 2023. PMID: 36839666 Free PMC article.
-
Dynamics of Erythroferrone Response to Erythropoietin in Rats.Front Pharmacol. 2022 Apr 20;13:876573. doi: 10.3389/fphar.2022.876573. eCollection 2022. Front Pharmacol. 2022. PMID: 35517793 Free PMC article.
-
A quantitative systems pharmacology model of hyporesponsiveness to erythropoietin in rats.J Pharmacokinet Pharmacodyn. 2021 Oct;48(5):687-710. doi: 10.1007/s10928-021-09762-z. Epub 2021 Jun 7. J Pharmacokinet Pharmacodyn. 2021. PMID: 34100188
References
-
- Koury MJ, Sawyer ST, Brandt SJ. New insights into erythropoiesis. Curr Opin Hematol. 2002;9(2):93–100. - PubMed
-
- Elliott S, Pham E, Macdougall IC. Erythropoietins: a common mechanism of action. Exp Hematol. 2008;36(12):1573–1584. - PubMed
-
- Richmond TD, Chohan M, Barber DL. Turning cells red: signal transduction mediated by erythropoietin. Trends Cell Biol. 2005;15(3):146–155. - PubMed
-
- Koury MJ, Bondurant MC. Maintenance by erythropoietin of viability and maturation of murine erythroid precursor cells. J Cell Physiol. 1988;137(1):65–74. - PubMed
-
- Testa U. Apoptotic mechanisms in the control of erythropoiesis. Leukemia. 2004;18(7):1176–1199. - PubMed
Publication types
MeSH terms
Substances
Grants and funding
LinkOut - more resources
Full Text Sources
Research Materials
