Comparative Study
. 2012 Dec 12;31(24):4563-75.
doi: 10.1038/emboj.2012.312. Epub 2012 Nov 27.

Skin squamous cell carcinoma propagating cells increase with tumour progression and invasiveness

Affiliations
Comparative Study

Skin squamous cell carcinoma propagating cells increase with tumour progression and invasiveness

Gaëlle Lapouge et al. EMBO J. .

Abstract

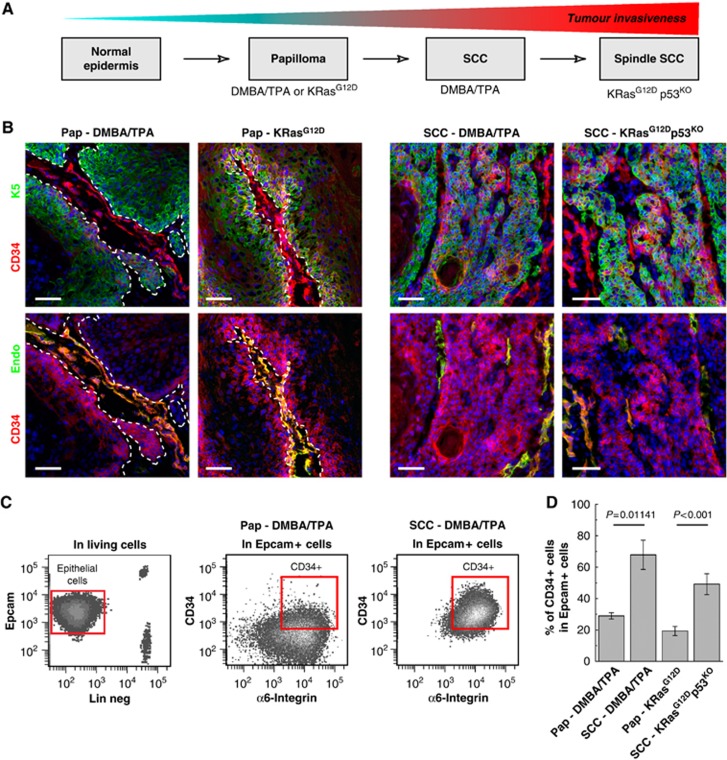
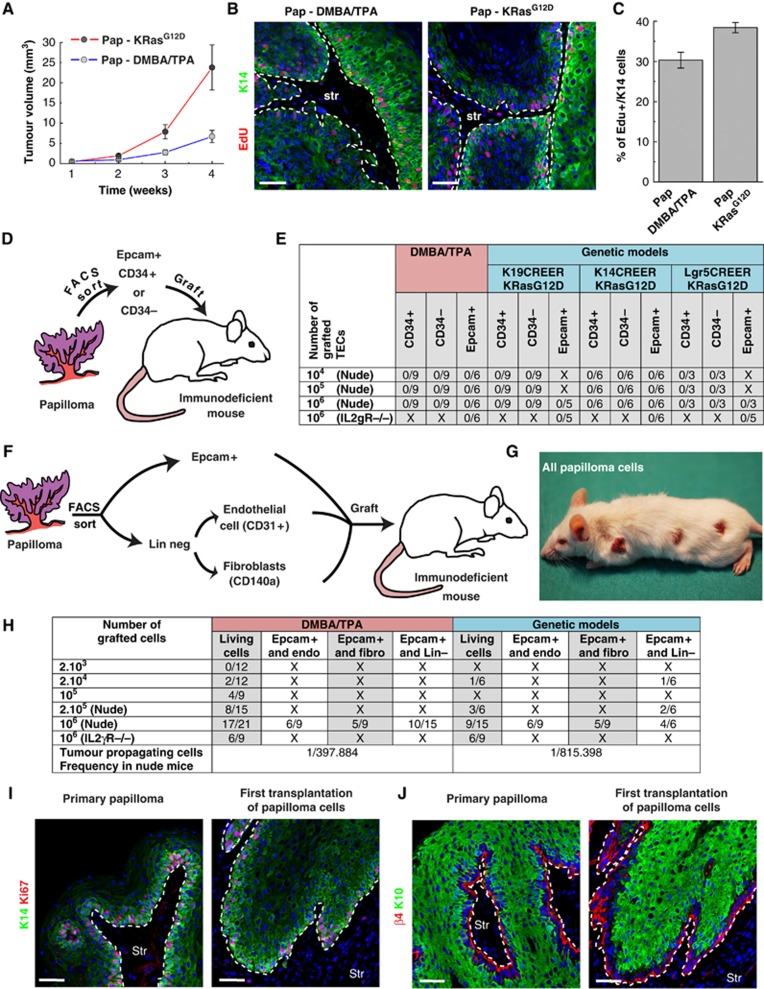
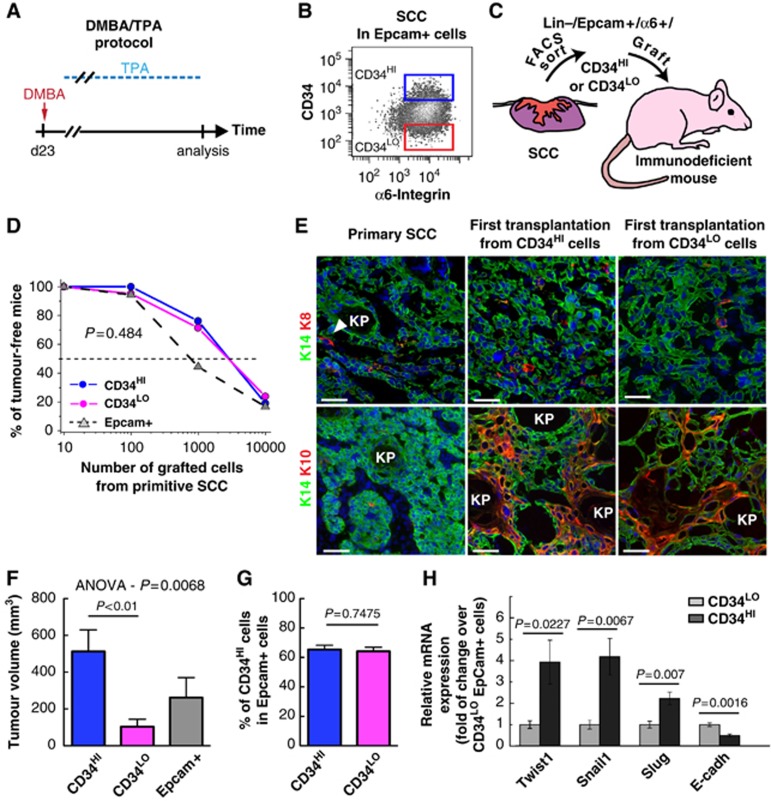
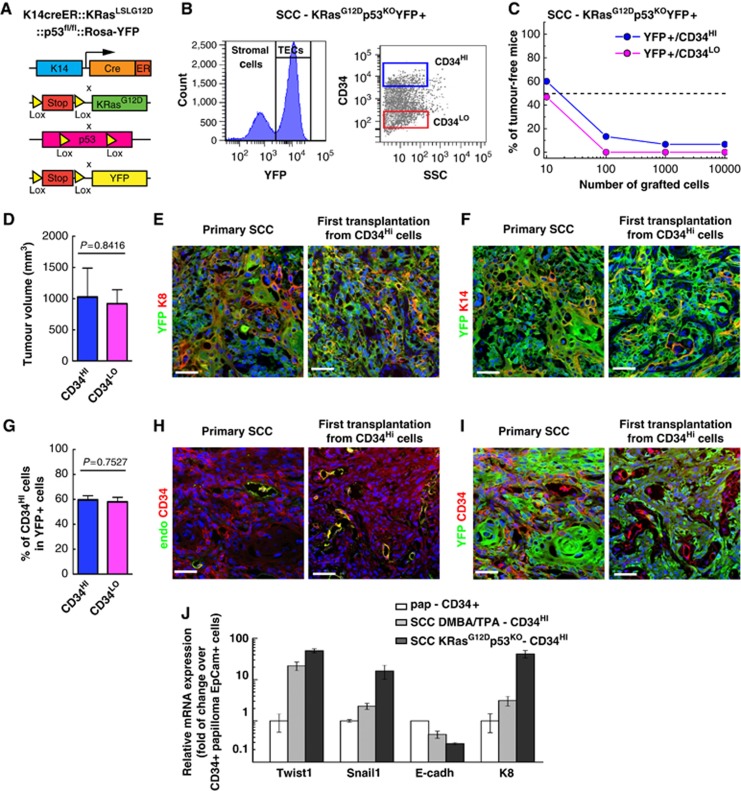
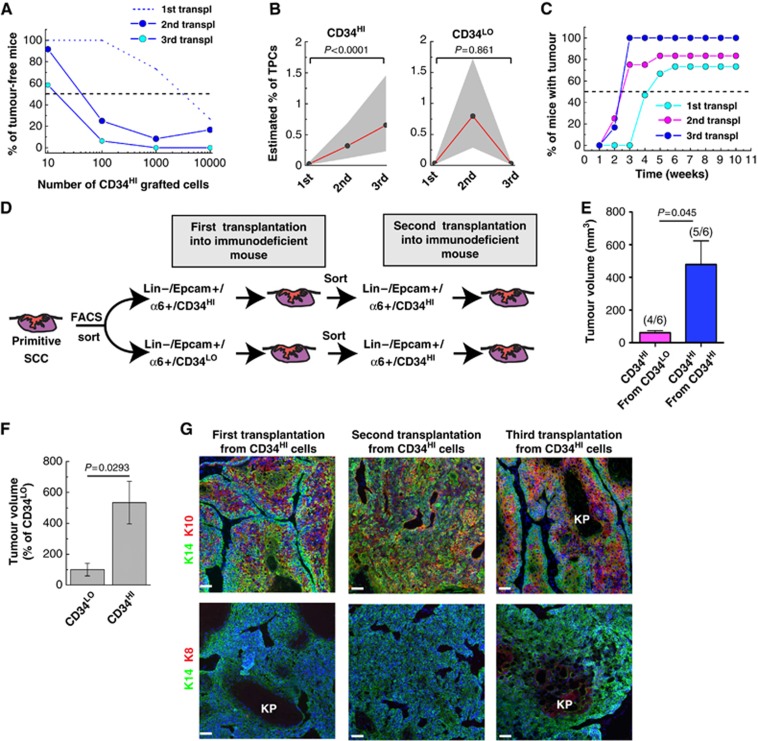
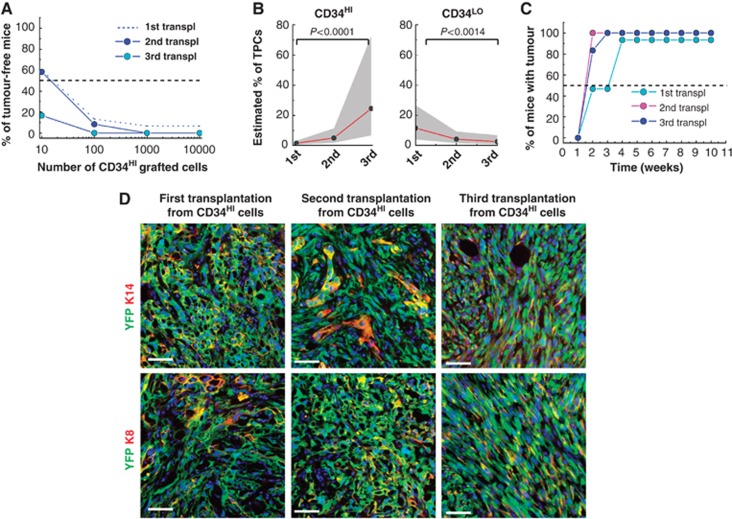
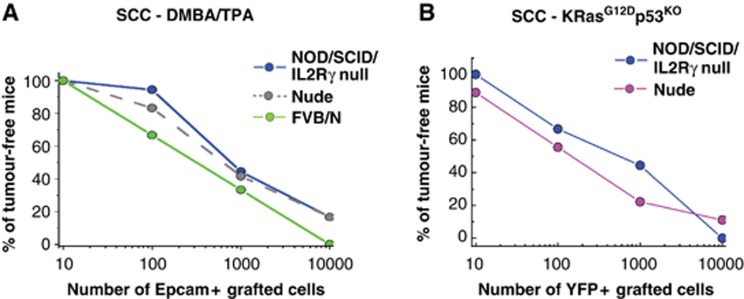
Cancer stem cells have been described in various cancers including squamous tumours of the skin by their ability to reform secondary tumours upon transplantation into immunodeficient mice. Here, we used transplantation of limiting dilution of different populations of FACS-isolated tumour cells from four distinct mouse models of squamous skin tumours to investigate the frequency of tumour propagating cells (TPCs) at different stages of tumour progression. We found that benign papillomas, despite growing rapidly in vivo and being clonogenic in vitro, reformed secondary tumours upon transplantation at very low frequency and only when tumour cells were co-transplanted together with tumour-associated fibroblasts or endothelial cells. In two models of skin squamous cell carcinoma (SCC), TPCs increased with tumour invasiveness. Interestingly, the frequency of TPCs increased in CD34(HI) but not in CD34(LO) SCC cells with serial transplantations, while the two populations initially gave rise to secondary tumours with the same frequency. Our results illustrate the progressive increase of squamous skin TPCs with tumour progression and invasiveness and reveal that serial transplantation may be required to define the long-term renewal potential of TPCs.


Conflict of interest statement

The authors declare that they have no conflict of interest.

Figures

Figure 1
Figure 1
CD34 is expressed in papilloma and carcinoma from different mouse models of skin tumours. (A) Scheme representing the progression of mouse skin tumours and the model used to study them. Adapted from Frame et al (1998). (B) Immunostaining for CD34 and K5 (upper panel) or CD34 and endothelial cell marker endoglin (endo—lower panel) showing the presence of CD34-expressing cells in all types of squamous tumours. (C) FACS analysis of the proportion of Lin−/α6+/Epcam+/CD34+ TEC population in benign papilloma and malignant SCC. (D) Histogram showing the percentage of Lin−/α6+/Epcam+/CD34+ cells in benign tumours (papilloma) arising from DMBA/TPA mice and in K19CREER::KRasG12D mice and in malignant carcinoma (SCC) arising from DMBA/TPA-treated mice and following TAM administration in K14CREER::KRasG12D::p53fl/fl mice (n=6 mice/condition). Pap, Papilloma. Scale bars represents 50 μm.
Figure 2
Figure 2
TECs from benign papilloma cannot be propagated into immunodeficient mice without tumour stromal cells. (A) Tumour volume of chemically (DMBA/TPA, blue) and genetically (KRasG12D, red) induced papilloma over time (n=32 tumours from three different mice per condition). Values are presented as mean values±s.e.m. (B) Immunostaining of EdU and K14 in DMBA/TPA and genetically induced papilloma, 4 h after an EdU pulse. (C) Proliferation of papilloma TECs. Quantification of percentage of EdU+/K5+ cells in papilloma arising from DMBA/TPA-treated and K19CREER::KRasG12D mice (D) Scheme representing the strategy used to isolate and grafted TECs from DMBA/TPA and KRasG12D papillomas. (E) Table summarizing the frequency of secondary tumour formation after subcutaneous injection of Lin−/α6+/Epcam+/CD34+, Lin−/α6+/Epcam+/CD34− or Lin−/α6+/Epcam+ epithelial cells from DMBA/TPA and genetically induced papilloma, into immunodeficient Swiss Nude and NOD/SCID/IL2Rγ null mice. (F) Scheme representing the strategy used to isolate and co-graft Lin−/α6+/Epcam+ cells with tumour endothelial cells (CD31+), tumour fibroblasts (CD140a+) or all tumour stromal cells (Lin neg). (G) Picture of a mouse grafted with 106 total living cells from DMBA/TPA-induced papilloma 6 weeks after grafting. (H) Table summarizing the frequency of secondary tumour formation after subcutaneous injection of Lin−/α6+/Epcam+ epithelial cells co-grafted with tumour endothelial cells, tumour fibroblasts or tumour stromal cells (Lin−) from DMBA/TPA and genetically induced papilloma, into immunodeficient Swiss Nude and NOD/SCID/IL2Rγ null mice. (I, J) Immunostaining of K14 and Ki67 (I) as well as β4 integrin and K10 (J) in primary papilloma and secondary (first transplantation) tumours arising from the transplantation of total tumour cells into immunodeficient mice. Scale bars represents 50 μm, str means stroma, Endo means Endothelial cells, fibro means fibroblast, Lin− means Lineage negative. Hoechst is represented in blue.
Figure 3
Figure 3
Low frequency of TPCs in primary CD34HI and CD34LO cell populations from DMBA/TPA-induced SCC. (A) Scheme representing the DMBA/TPA protocol to induce SCC formation. (B) FACS plot illustrating the gating of the Lin−/α6+/Epcam+/CD34HI and Lin−/α6+/Epcam+/CD34LO cells in DMBA/TPA-induced SCC. (C) Scheme representing the strategy used to isolate and graft Lin−/α6+/Epcam+/CD34HI, Lin−/α6+/Epcam+/CD34LO and Lin−/α6+/Epcam+ cells into immunodeficient mice. (D) Graph representing the percentage of tumour-free mice after subcutaneous injection of different concentrations of Lin−/α6+/Epcam+ cells into immunodeficient mice 10 weeks after transplantation (for details see Table I). Values are calculated from the sum of all biological replicates. (E) Immunostaining of K14 and K8 (upper panel) or K14 and K10 (lower panel) in the primary SCC and in the secondary (first transplantation) tumours originating from Lin−/α6+/Epcam+/CD34HI and Lin−/α6+/Epcam+/CD34LO cells. (F) Average volume of secondary tumours derived from Lin−/α6+/Epcam+/CD34HI (n=12), Lin−/α6+/Epcam+/CD34LO (n=11) or Lin−/α6+/Epcam+ cells (n=5). (G) FACS quantification of the proportion of Lin−/α6+/Epcam+/CD34HI amongst Lin−/α6+/Epcam+ cells in secondary tumours originating from Lin−/α6+/Epcam+/CD34HI (n=19) and Lin−/α6+/Epcam+/CD34LO (n=16) cells. (H) Expression of EMT-related genes by qRT–PCR in Lin−/α6+/Epcam+/CD34HI and Lin−/α6+/Epcam+/CD34LO TECs from DMBA/TPA-induced SCC (n=5). Data were normalized by gene expression in Lin−/α6+/Epcam+/CD34LO cells. Scale bars represent 50 μm.
Figure 4
Figure 4
Increased TPCs in more invasive genetically induced SCCs. (A) Scheme summarizing the genetic model used to induce SCC and study the frequency of TPCs in more highly invasive SCC. (B) FACS plot representing the strategy used to isolate Lin−/YFP+/CD34HI and Lin−/YFP+/CD34LO TECs based on YFP expression from K14CREER::KRasG12D::p53fl/fl::RosaYFP Tamoxifen-treated mice. (C) Graph representing the percentage of tumour-free mice 10 weeks after subcutaneous injection of different concentrations of Lin−/YFP+/CD34HI and Lin−/YFP+/CD34LO cells into immunodeficient mice (for details see Table I). (D) FACS quantification of the proportion of CD34 in Lin−/YFP+/CD34HI cells in secondary tumours originating from Lin−/YFP+/CD34HI (n=7) and from Lin−/YFP+/CD34LO cells (n=7). (E, F) Immunostaining of YFP and K8 (E) or YFP and K14 (F) in the primary KRasG12Dp53KOYFP+ SCC and the first transplantation from Lin−/YFP+/CD34HI cells. (G) Average volume of secondary tumours derived from Lin−/YFP+/CD34HI (n=8) or Lin−/YFP+/CD34LO cells (n=8). (H, I) Immunostaining of CD34 and endoglin (H) or YFP and CD34 (I) in the primary KRasG12Dp53KOYFP+ SCC and the secondary (first transplantation) carcinoma from Lin−/YFP+/CD34HI cells. (J) Expression of EMT-related genes by qRT–PCR in Lin−/YFP+/CD34HI epithelial cells from benign papilloma, DMBA/TPA (SCC DMBA) and genetically (KRasG12Dp53KO- SCC) induced SCC (n=5). Data were normalized to gene expression in Lin−/α6+/Epcam+/CD34+ papilloma cells. Scale bars represent 50 μm.
Figure 5
Figure 5
Increased frequency of TPCs upon serial transplantation in DMBA/TPA SCC. (A) Graph representing the percentage of tumour-free mice 10 weeks after subcutaneous injection of different concentrations of Lin−/α6+/Epcam+/CD34HI SCC cells from DMBA/TPA-treated SCC into immunodeficient mice after the first (dash line, data are presented in Figure 3D) (n=15 replicates), second (blue) (n=12 replicates) and the third (light blue) (n=6 replicates) transplantations. (B) Graph representing the estimated percentage of TPCs in Lin−/α6+/Epcam+/CD34HI (left) and Lin−/α6+/Epcam+/CD34LO (right) from DMBA/TPA-induced SCC during serial transplantations. Dots represent the estimated percentage of TPCs at each transplantation (detailed in Table I). Grey area represents the 95% confidence interval of the estimation. (C) Graph representing the percentage of mice with tumour at different time following subcutaneous injection of 104 Lin−/α6+/Epcam+/CD34HI cells from DMBA/TPA-induced SCC after the first, second and third serial transplantation of Lin−/α6+/Epcam+/CD34HI cells (see Table I for different transplanted of replicates). (D) Scheme summarizing the transplanted strategy to assess the conversion of Lin−/α6+/Epcam+/CD34LO into Lin−/α6+/Epcam+/CD34HI cells during serial transplantations of DMBA/TPA induced SCC. (E) Average volume of tertiary tumours (second transplantation) after the transplantation of 103 Lin−/α6+/Epcam+/CD34HI cells isolated from secondary DMBA/TPA induced SCC (first transplantation) tumours derived from Lin−/α6+/Epcam+/CD34HI grafted cells (n=5) or Lin−/α6+/Epcam+/CD34LO (n=4) cells. The values between brackets show the efficiency of tumour propagation for each population. (F) Graph representing the average size of quaternary tumours after the third round of serial transplantation of Lin−/α6+/Epcam+/CD34HI and Lin−/α6+/Epcam+/CD34LO cells from DMBA/TPA-induced SCC (n=6). (G) Immunostaining of K14 and K10 (upper panel) or K14 and K8 (lower panel) after the first, the second and the third transplantation of DMBA/TPA tumour cells. Scale bars represent 50 μm. KP, Keratin pearl.
Figure 6
Figure 6
Increased frequency of TPCs upon serial transplantation in CD34HI but not inCD34LO genetically induced SCC. (A) Graph representing the percentage of tumour-free mice 10 weeks after subcutaneous injection of different concentrations of Lin−/YFP+/CD34HI SCC cells into immunodeficient mice cells after the first (dash line, data are presented in Figure 4C) (n=15 replicates), second (blue) (n=12 replicates) and the third (light blue) (n=6 replicates) transplantations from KRasG12Dp53KOYFP+ SCCs. (B) Graph representing the estimated percentage of TPCs in Lin−/YFP+/CD34HI (left) and Lin−/YFP+/CD34LO (right) from KRasG12Dp53KOYFP+ induced SCC during serial transplantation. Dots represent the estimated frequency of TPCs (detailed in Table I). Grey area represents the 95% confidence interval of the estimation. (C) Graph representing the percentage of mice with tumour at different time following subcutaneous injection of 104 Lin−/YFP+/CD34HI cells from KRasG12Dp53KOYFP+ induced SCC after the first, the second and the third serial transplantation of Lin−/YFP+/CD34HI cells. (Number of replicates detailed in Table I). (D) Immunostaining of K14 and YFP (upper panel) or K8 and YFP (lower panel) in the first, the second and the third transplantation of genetically induced SCC. Scale bars represent 50 μm.
Figure 7
Figure 7
Transplantation into more severely immunodeficient mice does not increase the frequency of mouse SCC propagating cells. (A) Graph representing the percentage of tumour-free mice 10 weeks after subcutaneous injection of different concentrations of Lin−/α6/Epcam+ SCC cells from DMBA/TPA SCC into Swiss Nude mice (grey dash line, data are presented in Figure 3D), NOD/SCID/Il2Rγ null mice (blue line, n=9 replicates for each dilution) and FVB/N mice (green line, n=6 replicates for each dilution) 10 weeks after transplantation. (B) Graph representing the percentage of tumour-free mice 10 weeks after subcutaneous injection of different concentrations of Lin−/YFP+ SCC cells from KRasG12Dp53KOYFP+ SCC into Swiss Nude mice (pink line, n=9 replicates for each dilution), NOD/SCID/Il2Rγ null mice (blue line, n=9 replicates for each dilution) 10 weeks after transplantation.

References

    1. Abel EL, Angel JM, Kiguchi K, DiGiovanni J (2009) Multi-stage chemical carcinogenesis in mouse skin: fundamentals and applications. Nat Protoc 4: 1350–1362 - PMC - PubMed
    1. Alam M, Ratner D (2001) Cutaneous squamous-cell carcinoma. N Engl J Med 344: 975–983 - PubMed
    1. Ansieau S, Bastid J, Doreau A, Morel AP, Bouchet BP, Thomas C, Fauvet F, Puisieux I, Doglioni C, Piccinin S, Maestro R, Voeltzel T, Selmi A, Valsesia-Wittmann S, Caron de Fromentel C, Puisieux A (2008) Induction of EMT by twist proteins as a collateral effect of tumor-promoting inactivation of premature senescence. Cancer Cell 14: 79–89 - PubMed
    1. Barker N, van Es JH, Kuipers J, Kujala P, van den Born M, Cozijnsen M, Haegebarth A, Korving J, Begthel H, Peters PJ, Clevers H (2007) Identification of stem cells in small intestine and colon by marker gene Lgr5. Nature 449: 1003–1007 - PubMed
    1. Barrett LE, Granot Z, Coker C, Iavarone A, Hambardzumyan D, Holland EC, Nam HS, Benezra R (2012) Self-renewal does not predict tumor growth potential in mouse models of high-grade glioma. Cancer Cell 21: 11–24 - PubMed

Publication types