Review
. 2013 Jun;37(6):1301-25.
doi: 10.1002/jmri.23945. Epub 2012 Nov 27.

MR spectroscopic imaging: principles and recent advances

Affiliations
Review

MR spectroscopic imaging: principles and recent advances

Stefan Posse et al. J Magn Reson Imaging. 2013 Jun.

Abstract

MR spectroscopic imaging (MRSI) has become a valuable tool for quantifying metabolic abnormalities in human brain, prostate, breast and other organs. It is used in routine clinical imaging, particularly for cancer assessment, and in clinical research applications. This article describes basic principles of commonly used MRSI data acquisition and analysis methods and their impact on clinical applications. It also highlights technical advances, such as parallel imaging and newer high-speed MRSI approaches that are becoming viable alternatives to conventional MRSI methods. Although the main focus is on (1) H-MRSI, the principles described are applicable to other MR-compatible nuclei. This review of the state-of-the-art in MRSI methodology provides a framework for critically assessing the clinical utility of MRSI and for defining future technical development that is expected to lead to increased clinical use of MRSI. Future technical development will likely focus on ultra-high field MRI scanners, novel hyperpolarized contrast agents using metabolically active compounds, and ultra-fast MRSI techniques because these technologies offer unprecedented sensitivity and specificity for probing tissue metabolic status and dynamics.


Figures

Figure 1.
Figure 1.
Principles of MRSI. a–c: Equivalence of readout and phase encoding illustrated by stepwise transformation of readout encoding into phase encoding. (b) Segmentation of the readout gradient “G” into gradient pulses with interleaved collection of single data points (red arrows). c: Collection of the same data points in separate experiments using phase encoding. d: Phase encoding with constant gradient duration. e: Spatially periodic spin phase distribution along the direction of the phase encoding gradients; the spatial periodicity of the spin phase, which is characterized by the wavelength λ, increases with the stepwise increase in the phase encoding gradient amplitude. f: Spectroscopic imaging by combining phase encoding with a spectroscopic readout; the amplitude and phase of the initial data point (red arrow) represents the spatial information embedded in the spectroscopic signal.
Figure 2.
Figure 2.
Point spread function in MRSI for (a) a point source located in the center of the voxel (x = 0), which results in perfect localization without any signal contamination in adjacent voxels and (b) a point source located at the right edge of the voxel (x = 0.5), which results in a significant signal contamination into adjacent voxels.
Figure 3.
Figure 3.
kt-space in MRSI and effect of magnetic field inhomogeneity. a: K-space is invariant along the time axis in a homogeneous magnetic field. The decay of the encoded signals follows the time axis. b: K-space and the encoded signal move outside of the encoded data space due to a global gradient along the y-direction, which accelerates the signal decay and broadens spectral lines.
Figure 4.
Figure 4.
Echo-planar spatial-spectral encoding. a: Conventional MRSI acquisition with sampling points indicated by red lines. The spacing between sampling points is the spectroscopic dwell time (dt). b: Interleaving of pairs of echo-planar readout gradients into the spectroscopic acquisition creates a series of even and odd gradient echoes.
Figure 5.
Figure 5.
Automated prelocalization of the MRSI volume of interest in reference to a brain atlas. The MRSI slab and outer volume suppression slices are optimally positioned in the Montreal Neurological Institute brain atlas. An affine transformation based on the spatial normalization of the subject’s brain into the atlas space enables automated placement of the MRSI slab and outer volume suppression slices in subject space.
Figure 6.
Figure 6.
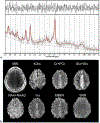
High spatial resolution mapping of J-coupled metabolites in human brain at 3 Tesla using short TE (15 ms) proton-echo-planar-spectroscopic-imaging (PEPSI). a: Localized spectrum in central gray matter with spectral fit using LCModel software (red). b: High-resolution MRI, partial volume and relaxation-corrected metabolite images, and signal-to-noise-ratio map (SNR). Data were acquired with 4.5 mm in-plane resolution and 15 mm slice thickness (0.3 cc voxel size) in a supraventricular slice location using a 32-channel array coil and 32 min acquisition time.
Figure 7.
Figure 7.
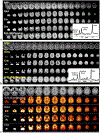
Whole brain mapping of metabolites using echo-planar-spectroscopic-imaging (EPSI) at 3 Tesla (68). a: Single subject at intermediate echo time (70 ms), (b) single subject at short echo time (20 ms) and (c) group average from 47 female and 41 male subjects at intermediate echo time (70 ms). Spatial normalization was applied. Intermediate echo time data were acquired using a 12-channel coil and 26 min acquisition time, with 50 × 50 × 18 k-space points interpolated to 64 × 64 × 32 and 5.6 × 5.6 × 10 mm (0.31 cc) voxel size. Short TE data were acquired in 15 min. (Adapted from: Mapping of brain metabolite distributions by volumetric proton MR spectroscopic imaging (MRSI). Maudsley AA, Domenig C, Govind V, Darkazanli A, Studholme C, Arheart K, Bloomer C. Magn Reson Med 2009;61:548–559. Copyright © 2008 by John Wiley and Sons, Inc. Reprinted by permission of John Wiley and Sons, Inc.).
Figure 8.
Figure 8.
The 3D glutamate mapping in human brain comparing TE-averaging versus short TE acquisition at 3 Tesla. a: MRI, metabolite maps and central spectra with spectral fit using LCModel software. b: Quantification of metabolites in central slice showing slice averages of metabolite ratio with respect to Cr, Cramer-Rao lower bounds (CRLB), number of voxels above a CRLB threshold of 50%, spectral line width and signal-to-noise-ratio. TE averaged 3D PEPSI data were acquired with TR: 1.5 s and 8 echo times ranging from 15 to 165 ms with 20 ms steps using 27-min 30-s scan time. Short TE (15 ms) 3D PEPSI data were acquired with TR: 1.5 s, 4 averages and 13 min 48-s scan time. Spectral fitting was performed with simulated basis sets.
Figure 9.
Figure 9.
The 3D mapping of GABA in human brain using PEPSI with MEGA-editing at 3 Tesla. a: Difference spectrum from supraventricular gray matter with spectral assignments. b: GABA maps from 3 slices within the MRSI slab and representative spectra from voxel locations shown in the axial MRIs. Acquisition parameters: TR/TE: 2 s/68 ms, spatial matrix: 32 × 32 × 8, voxel size: 1.5 × 1.5 × 1.5 cm3, scan time: 18 min.
Figure 10.
Figure 10.
The 3D metabolite mapping in a patient with a brain tumor at 3 Tesla using short TE (15 ms) PEPSI. a: Localized spectra in the periphery of the tumor show elevated Choline and lipid peaks. Decreased Creatine and NAA, and strongly elevated lipid peaks are measured in the center of the tumor. b: T2-weighted MRI, metabolite maps and water reference scan demonstrate spatial heterogeneity of the lesion. Data were acquired in 10 min including water reference scan using 32 × 32 × 8 spatial matrix and 7 mm isotropic voxel dimensions (0.34 cc voxel size).
Figure 11.
Figure 11.
shows a PEPSI study at 3 Tesla in a 13-month-old infant at high-risk for Autism Spectrum Disorder. a: 3D short TE (15 ms) acquisition encompassing the cerebellum with voxel size = 0.34 cc acquired in 5.5 min. The 3D spectral array on the left is a subregion from a single slice, as shown in red in the middle figure, with the entire 3D volume shown on the right. b: GABA-edited 2-D PEPSI MRSI acquired from the cerebrum in 8.5 min with voxel size = 4 cc, showing a clearly resolved GABA peak at 3ppm.
Figure 12.
Figure 12.
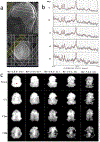
The 3D mapping of choline, a biomarker of breast cancer, in a patient with multifocal invasive ductal carcinoma grade 3 using PEPSI with MEGA lipid suppression and PRESS volume selection at 3 Tesla. a: Spectrum from the lesions in slice 4 with elevated choline and residual lipid signals. b: Corresponding voxel location superimposed on high resolution MRI. The white box indicates the PRESS volume selection. c: Dynamic contrast enhanced subtraction images and choline maps. Data acquisition parameters: TR/TE: 2 s/136 ms, matrix size: 32 × 8 × 8 voxels, voxel size: 1 cc, acquisition time including water reference scan: 10 min.
Figure 13.
Figure 13.
A 31P MRSI obtained from a patient with breast cancer during chemotherapy (120). Phosphomonoesters (PE), phosphodiesters (GPE, GPC), and inorganic phosphate (Pi) can be mapped in 3D over the breast at a spatial resolution of 10 cc in an acquisition time of 20 min at 7 Tesla (a). The elevated PE levels in the tumor before treatment (b) return to similar levels as in glandular tissue (b) during chemotherapy as reflected by the colored overlay of the PE level over the lipid suppressed MRI of the human breast (b–d). Only one slice of the 3D data set is shown (Courtesy: Dr. Dennis Klomp and Dr. Vincent O. Boer - University Medical Center Utrecht, Utrecht, the Netherlands).
Figure 14.
Figure 14.
Multi-slice spectroscopic imaging of the human brain at 7 Tesla with an eight-element transmit coil (51). a: MRI with overlaid slice locations and one of the five slices with voxel locations. b: Corresponding spectra, where differences in the glutamate and choline and creatine ratios are apparent. In the WM the NAAG signal can be seen as a small shoulder on the right side of the NAA peak. The stable macromolecular signal indicates the high degree of lipid suppression even without in-plane volume selection and at a very short TE (2.75 ms). c: Supraventricular slice. d: Corresponding Glu/NAA map showing GM/WM contrast. Five slices with a 25 × 25 matrix were acquired in 18 min (Courtesy: Dr. Dennis Klomp and Dr. Vincent O. Boer - University Medical Center Utrecht, Utrecht, the Netherlands).
Figure 15.
Figure 15.
Simulated SENSE acceleration of 2D PEPSI data acquired at 3 Tesla using a 32-channel array. a: Slice localization. b: Spectra with LCModel fit from central gray matter with up to 5-fold acceleration (Ry), which corresponds to an effective acquisition time of 12 s. c: Metabolite maps of Choline, Creatine and Glutamate with up to 5-fold acceleration. Acquisition parameters: TE: 15 ms, TR: 2 s, 32 × 32 matrix, voxel size: 1.1 cc, acquisition time: 64 s.

Similar articles

Cited by

References

    1. Brown TR, Kincaid BM, Ugurbil K. NMR chemical shift imaging in three dimensions. Proc Natl Acad Sci U S A 1982;79:3523–3526. - PMC - PubMed
    1. Maudsley AA, Hilal SK, Perman WH, Simon HE. Spatially resolved high resolution spectroscopy by “four-dimensional” NMR. J Magn Reson (1969) 1983;51:147–152.
    1. Alger JR. Quantitative proton magnetic resonance spectroscopy and spectroscopic imaging of the brain: a didactic review. Top Magn Reson Imaging 2011;21:115–128. - PMC - PubMed
    1. Yung KT, Zheng W, Zhao C, Martinez-Ramon M, van der Kouwe A, Posse S. Atlas-based automated positioning of outer volume suppression slices in short-echo time 3D MR spectroscopic imaging of the human brain. Magn Reson Med 2011;66:911–922. - PubMed
    1. Maudsley AA, Domenig C, Sheriff S. Reproducibility of serial whole-brain MR spectroscopic imaging. NMR Biomed 2010;23:251–256. - PMC - PubMed

Publication types

MeSH terms

LinkOut - more resources