. 2012 Dec 11;109(50):20738-43.
doi: 10.1073/pnas.1213381109. Epub 2012 Nov 27.

Orthogonal acoustic dimensions define auditory field maps in human cortex

Affiliations

Orthogonal acoustic dimensions define auditory field maps in human cortex

Brian Barton et al. Proc Natl Acad Sci U S A. .

Abstract

The functional organization of human auditory cortex has not yet been characterized beyond a rudimentary level of detail. Here, we use functional MRI to measure the microstructure of orthogonal tonotopic and periodotopic gradients forming complete auditory field maps (AFMs) in human core and belt auditory cortex. These AFMs show clear homologies to subfields of auditory cortex identified in nonhuman primates and in human cytoarchitectural studies. In addition, we present measurements of the macrostructural organization of these AFMs into "clover leaf" clusters, consistent with the macrostructural organization seen across human visual cortex. As auditory cortex is at the interface between peripheral hearing and central processes, improved understanding of the organization of this system could open the door to a better understanding of the transformation from auditory spectrotemporal signals to higher-order information such as speech categories.


Conflict of interest statement

The authors declare no conflict of interest.

Figures
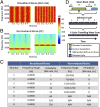
Fig. 1.
Fig. 1.
Experimental stimuli and design. The sound spectrogram across frequencies (vertical axes) and time (horizontal axes). Increasing sound energy is represented as increasingly “warmer” colors. (A) Example broadband noise stimuli with amplitude modulation (AM) rates of 8 (Left) and 16 Hz (Right). (B) Example narrowband noise stimuli with center frequencies (CF) of 1,600 (Left) and 3,200 Hz (Right). (C) All experimental stimuli. Broadband noise stimuli maintain constant frequency information and vary periodicity, whereas narrowband noise stimuli hold periodicity constant and vary frequency. (D) Sparse sampling traveling wave experimental design (SI Text and Fig. S1).
Fig. 2.
Fig. 2.
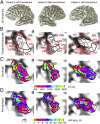
Anatomical and functional data in auditory core and belt. (Left) Data in subject 4's (S4’s) left hemisphere and (Middle) in S4’s right hemisphere. (Right) Data in S3′s left hemisphere. Light gray indicates gyri; dark gray indicates sulci. (A) A 3D rendering of individual cortical surfaces. Circles indicate HG and surrounding regions presented in (B). (B) Flattened cortical surface of HG and surrounding regions for each hemisphere, orientated to align STG. Solid black lines indicate AFM boundaries between maps along mirror-symmetric tonotopic reversals, which separate clover leaf clusters from one another. Dotted black lines indicate AFM boundaries between maps within a clover leaf cluster, in mirror-symmetric periodotopic reversals. Red text indicates AFM names; black text indicates gyri names. (C) Tonotopy mapped using narrowband noise stimuli. Colors indicate the preferred frequency range for each voxel (CF, in hertz). (D) Periodotopy mapped using broadband noise stimuli. Colors indicate the preferred period range for each voxel (AM rate, in hertz). Each voxel is measured independently with no spatial or temporal smoothing and no motion correction. Voxels presented have coherence above the statistical threshold of 0.20 and are within one of the 11 AFMs presently studied. Scale bar denotes 1 cm along the flattened cortical surface.
Fig. 3.
Fig. 3.
Orthogonal tonotopic and periodotopic representations. (A) Tonotopy and (B) periodotopy. (Left) Data in S4’s right hemisphere. (Center) Data in S2’s left hemisphere. (Right) Data in S1’s left hemisphere. (Inset) Scale bar denotes 1 cm along the flattened cortical surface for images in (A) and (B). Details of (A) and (B) as in Fig. 2. (C) Model tuning for tonotopy (Top) and periodotopy (Bottom) in hA1. Red regions indicate low stimulus values (e.g., low frequency for tonotopy or low-modulation rate for periodotopy); blue regions indicate high-stimulus values. (D) Vectors were drawn from centers of low-stimulus value region of interests (ROIs) to high stimulus value ROIs for tonotopy (Top) and periodotopy (Bottom). (E) Vector offset predicted by orthogonal tonotopic and periodotopic gradients physically (Top) and graphically (Bottom). (F) Results of the vector offset test for orthogonality for each AFM, averaged across all eight hemispheres. All maps have an offset of about 90°, confirming that the two gradients are orthogonal. Error bars indicate SEM.
Fig. 4.
Fig. 4.
Orthogonal tonotopy and periodotopy in narrow-range ROIs. Data are from ROIs defined across all 11 AFMs in S4’s left hemisphere. Specific narrow-range ROIs were created from voxels with statistically significant activity (coherence ≥ 0.20) for a specific range (e.g., 400–800 Hz) of a stimulus type (e.g., tonotopy), as noted above each column. (A) The 400–800-Hz tonotopy ROI. (B) The 8–16-Hz periodotopy ROI. Plots show data for responses either for the defining stimulus type [narrow-range tonotopic responses (Upper Left); narrow-range periodotopic responses (Lower Right)] or for the orthogonal stimulus type [periodotopic responses within tonotopic-defined ROI (Lower Left); tonotopic responses within periodotopic-defined ROI (Upper Right)]. It is key to note that within each narrow-range ROI, the entire range of the other acoustic dimension is represented. These results further confirm that the tonotopic and periodotopic representations are orthogonal. See Fig. S5 for additional examples.
Fig. 5.
Fig. 5.
Model of clover leaf cluster organization and comparison with human anatomy and cytoarchitecture. “L” stands for “low” and “H” stands for “high,” referring to low (red regions) or high (blue regions) model tonotopic or periodotopic responses. Dark gray indicates sulci or the plane of the Sylvian fissure, while light gray indicates gyri. Purple regions represent auditory core. Orange regions indicate auditory belt. Green regions indicate auditory parabelt. Yellow regions indicate temporal planum temporal (Tpt). All figures are oriented along the same global axes (Insets). All models are representations of the original models cited above each figure, modified for consistency here. (A) Our human core/belt tonotopy model. (B) Our human core/belt periodotopy model. (C) Our tonotopic model of human belt and core. (D) Cytoarchitectonic model of human auditory cortex.

References

    1. Engel SA, et al. fMRI of human visual cortex. Nature. 1994;369(6481):525. - PubMed
    1. Sereno MI, et al. Borders of multiple visual areas in humans revealed by functional magnetic resonance imaging. Science. 1995;268(5212):889–893. - PubMed
    1. DeYoe EA, et al. Mapping striate and extrastriate visual areas in human cerebral cortex. Proc Natl Acad Sci USA. 1996;93(6):2382–2386. - PMC - PubMed
    1. Brewer AA, Liu J, Wade AR, Wandell BA. Visual field maps and stimulus selectivity in human ventral occipital cortex. Nat Neurosci. 2005;8(8):1102–1109. - PubMed
    1. Wandell BA, Winawer J. Imaging retinotopic maps in the human brain. Vision Res. 2011;51(7):718–737. - PMC - PubMed

Publication types