. 2012 Dec 11;109(50):20572-7.
doi: 10.1073/pnas.1213069109. Epub 2012 Nov 27.

Thymic nurse cells provide microenvironment for secondary T cell receptor α rearrangement in cortical thymocytes

Affiliations

Thymic nurse cells provide microenvironment for secondary T cell receptor α rearrangement in cortical thymocytes

Yasushi Nakagawa et al. Proc Natl Acad Sci U S A. .

Abstract

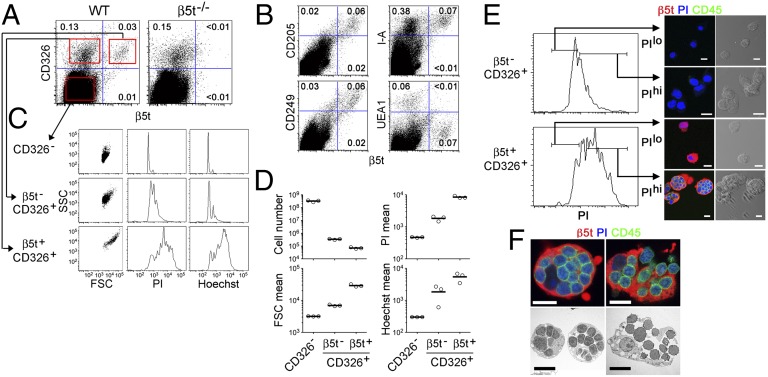
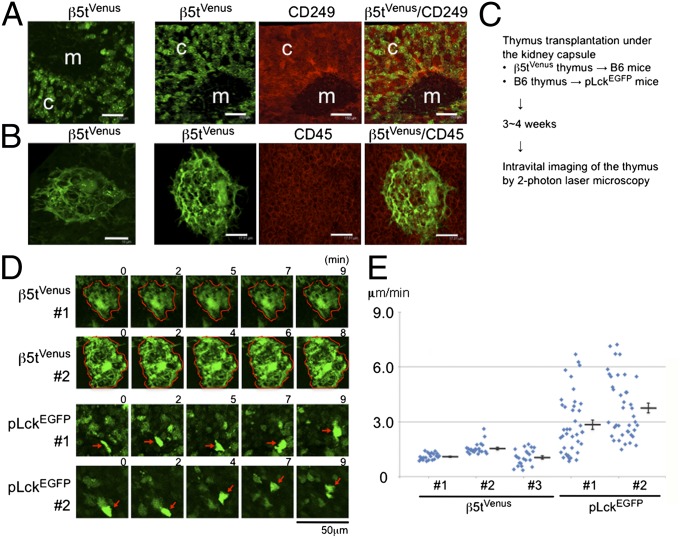
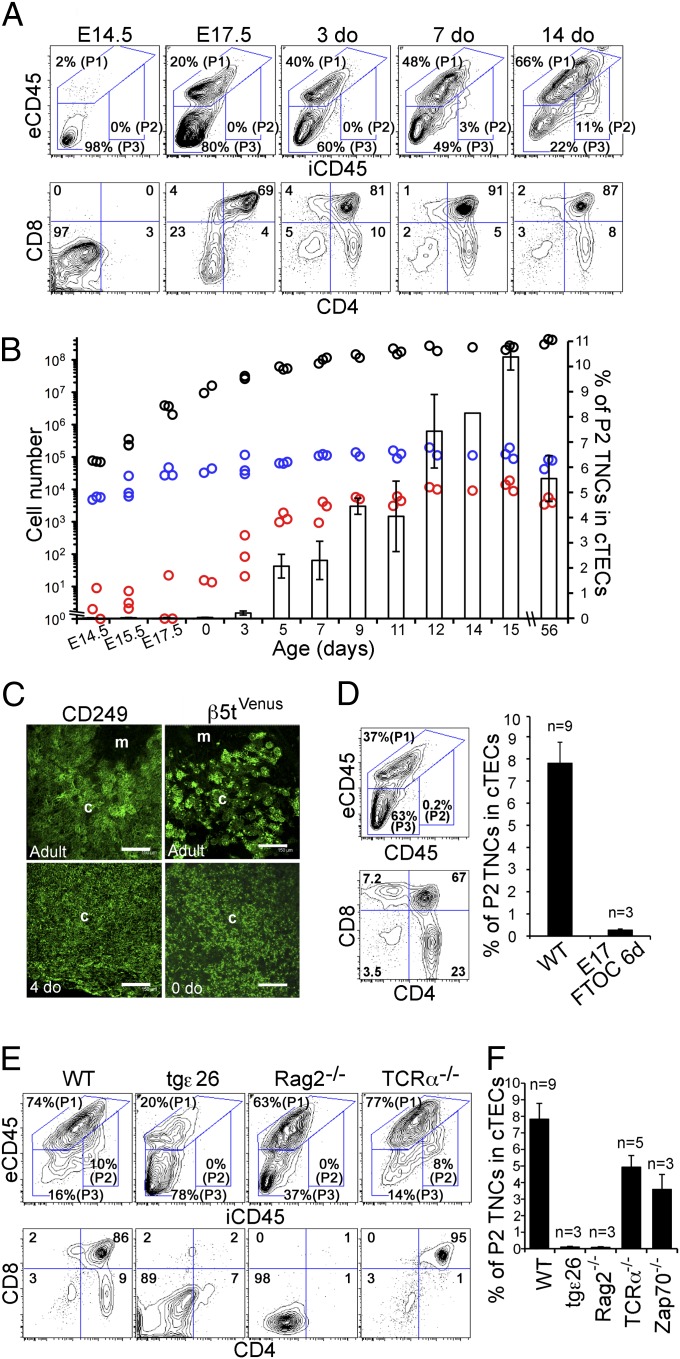
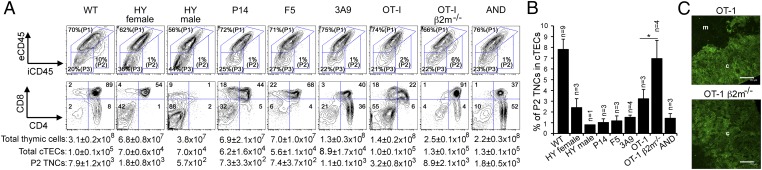
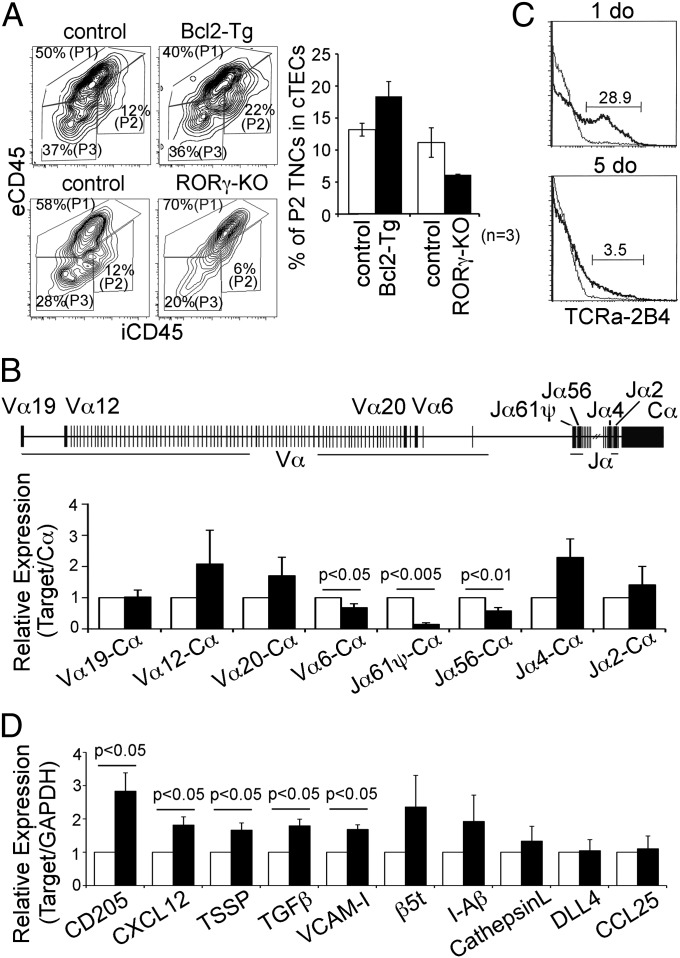
Distinct subsets of thymic epithelial cells (TECs) support T-cell development and selection. Isolated TECs contain multicellular complexes that enclose many viable thymocytes. However, the functions of those TECs, termed thymic nurse cells (TNCs), are unclear and the idea that TNCs are present in vivo is questioned. Here, we show that TNCs represent a fraction of cortical (c)TECs that are defined by the expression of thymoproteasomes. Intravital imaging revealed TNCs in the thymic cortex in situ, whereas TNCs were detected neither during embryogenesis nor in the postnatal thymuses of various "positive-selector" T-cell receptor (TCR)-transgenic mice, indicating that TNCs are not essential for T-cell differentiation, including positive selection. Rather, cells within TNCs were enriched for long-lived CD4(+)CD8(+) thymocytes that underwent secondary TCR-Vα rearrangement. Thus, TNC complexes are formed in vivo by persistent cTEC-thymocyte interactions that then provide a microenvironment that optimizes T-cell selection through secondary TCR rearrangement.


Conflict of interest statement

The authors declare no conflict of interest.

Figures

Fig. 1.
Fig. 1.
Association of β5t+ cTECs with CD45+ thymocytes. (A) Collagenase-digested cell suspensions of thymuses from wild-type (WT) (C57BL/6) mice and β5t−/− mice were analyzed by flow cytometry for intracellular β5t and cell surface CD326. Numbers indicate frequencies of cells within boxes. Representative profiles of three independent measurements are shown. (B) Flow-cytometric profiles of collagenase-digested cell suspension of WT thymus for intracellular β5t and indicated cell surface molecules. Representative profiles of three independent measurements are shown. (C) Thymic cell populations, gated as shown in red boxes in A, were analyzed for forward-scatter intensity (FSC), side scatter intensity (SSC), PI staining, and Hoechst 33342 (Hoechst) staining. All of the parameters are plotted in the logarithmic scale. Representative profiles of three independent measurements are shown. (D) Cell number per mouse and geometric mean values of FSC intensity, PI-staining intensity, and Hoechst-staining intensity of indicated cell populations. Open circles indicate values for individual mice and bars indicate means (n = 3). (E) β5tCD326+ and β5t+ CD326+ thymic cells were sorted into PIlow or PIhigh cells, as defined in the left graphs. Sorted cells were further stained for CD45 and analyzed by confocal microscopy. Representative results of three-color fluorescence images and transmitted light images are shown (n = 2). (F) Isolated β5t+ CD326+ thymic cells further stained for CD45 and PI (Upper) were analyzed by transmission electron microscopy (Lower). Representative images of closed (Left) and open (Right) complexes are shown (confocal microscopic data from five independent experiments and electron microscopy data from two independent experiments). (Scale bars: 10 μm.)
Fig. 2.
Fig. 2.
In situ detection of cTEC–thymocyte complexes. (A and B) Confocal microscopy of thymuses from β5tVenus/+ mice. Venus fluorescence (green) and indicated antibody-stained fluorescence (red) are shown. Cortical region (c) and medullary region (m) are indicated in A. (Scale bars: A, 150 μm; B, 18 μm.) Representative images of four independent measurements are shown. (CE) Intravital imaging of β5tVenus+ cTECs and pLckEGFP+ thymocytes. Time-lapse images obtained from the experiments briefly described in C are shown in Movies S1, S2, S3, and S4. Representative images of β5tVenus+ cTECs and pLckEGFP+ thymocytes are shown in D. Red arrows indicate the tracing of individual cells in a set of time-lapse images (D). Average velocities of individual cells (n = 22 for cTECs; n = 40 for thymocytes) and means and SEs of measurements of individual mice (E) show that cTECs are dormant in comparison with thymocytes, which exhibit heterogeneous cellular movement as reported previously (–31).
Fig. 3.
Fig. 3.
Ontogeny and formation of cTEC–thymocyte complexes in T-cell–deficient mice. (A and B) Collagenase-digested cells of B6 thymus at the indicated age were analyzed as shown in Fig. S1. Representative flow-cytometric profiles of extracellular CD45 (eCD45) and intracellular CD45 (iCD45) in β5t+ CD326+ cTECs (Upper) and of cell surface CD4 and CD8 in total cells (Lower) are shown in A. Numbers indicate frequencies of cells within indicated areas (A). Numbers per mouse of total thymic cells (black circles), total β5t+ CD326+ cTECs (blue circles), and P2 TNC subpopulation of cTECs (red circles) are plotted in B. Symbols in B indicate measurement results from individual mice. The frequency (means and SEs) of P2 TNCs in cTECs is also plotted (B). (C) Confocal microscopy of anti-CD249 antibody–stained thymus sections from B6 mice (Left) and unstained thymus sections from β5tVenus/+ mice (Right) at the indicated age. Representative images of fluorescence signals from three independent measurements are shown. Cortical region (c) and medullary region (m) are indicated. (Scale bars: 150 μm.) (D) Cells were obtained from 6-d organ-cultured E17.5 B6 fetal thymus lobes. Representative flow-cytometric profiles of eCD45 and iCD45 in β5t+ CD326+ cTECs (Upper) and of cell surface CD4 and CD8 in total cells (Lower) are shown. Numbers indicate frequencies of cells within indicated areas. The frequency (means, SEs, and number of measurements) of P2 TNCs in cTECs is also plotted. (E and F) Representative flow-cytometric profiles of eCD45 and iCD45 in β5t+ CD326+ cTECs (Upper) and of cell surface CD4 and CD8 in total cells (Lower) in indicated mice are shown. Numbers indicate frequencies of cells within indicated areas. The frequency (means, SEs, and number of measurements) of P2 TNCs in cTECs is plotted in F.
Fig. 4.
Fig. 4.
Formation of cTEC–thymocyte complexes in TCR-transgenic mice. (A and B) Representative flow-cytometric profiles of eCD45 and iCD45 in β5t+ CD326+ cTECs (Upper) and of cell surface CD4 and CD8 in total cells (Lower) in indicated mice are shown. Numbers indicate frequencies of cells within indicated areas. The number (means and SEs) of total thymic cells, total cTECs, and P2 TNCs are also indicated (A, Lower). The frequency (means, SEs, and number of measurements) of P2 TNCs in cTECs is plotted in B. (C) Confocal microscopy of anti-CD249 antibody–stained thymus sections from indicated mice. Representative images of fluorescence signals from four independent measurements are shown. Cortical region (c) and medullary region (m) are indicated. (Scale bars: 150 μm.)
Fig. 5.
Fig. 5.
Persistent interaction of cTECs with long-lived thymocytes leads to TNC complex formation for secondary TCRα rearrangement. (A) Representative flow-cytometric profiles of eCD45 and iCD45 in β5t+ CD326+ cTECs of indicated mice are shown. Numbers indicate frequencies of cells within indicated areas. The frequency (means, SEs, and number of measurements) of P2 TNCs in cTECs is plotted (Right). (B) Schematic map of mouse TCRα locus shows the locations of and loci analyzed for expression in CD4+CD8+ thymocytes. CD4+CD8+ thymocytes enclosed in TNCs (closed bars) were isolated from eCD45 cells mechanically released from purified CD205+CD326+ cTECs of B6 mice as shown in Fig. S2. Total CD4+CD8+ thymocytes were isolated as control (open bars). Rearranged - and - mRNA expression levels were measured by quantitative RT-PCR analysis and normalized to total mRNA expression levels. Bar graphs show means ± SEs of three independent measurements. (C) CD4+CD8+ thymocytes of heterozygous knock-in (KI) mice carrying the rearranged 2B4 TCR VαJα gene to replace the genomic Jα50-Jα47 segment were isolated at 1 d old (1 do) or 5 d old (5do) and stained for cell surface 2B4 TCRα (solid lines) or for control profiles by normal IgG (gray lines). Numbers indicate frequencies of cells within indicated areas. Representative results of three independent measurements are shown. (D) eCD45CD205+CD326+ TNC complexes were isolated from B6 mice and mechanically separated from enwrapping CD4+CD8+ thymocytes. mRNA expression levels of indicated genes in TNC cTECs in comparison with total cTECs was measured by quantitative RT-PCR analysis. The separation of TNC cTECs from CD4+CD8+ thymocytes was confirmed by the reduction of CD4 mRNA expression level (less than 14% of the expression levels in comparison with total thymocytes). Means ± SEs of three independent measurements are shown.

Similar articles

Cited by

References

    1. Bacci G. [Histochemical data on oocytes and nurse cells of Ophryotrocha puerilis.] Boll Soc Ital Biol Sper. 1952;28(6):1293–1295. - PubMed
    1. Mische S, Li M, Serr M, Hays TS. Direct observation of regulated ribonucleoprotein transport across the nurse cell/oocyte boundary. Mol Biol Cell. 2007;18(6):2254–2263. - PMC - PubMed
    1. Fritz IB. Reflections on the evolution of the regulation of spermatogenesis. Prog Clin Biol Res. 1986;226:371–388. - PubMed
    1. Rao MK, et al. Tissue-specific RNAi reveals that WT1 expression in nurse cells controls germ cell survival and spermatogenesis. Genes Dev. 2006;20(2):147–152. - PMC - PubMed
    1. Despommier DD. Trichinella spiralis and the concept of niche. J Parasitol. 1993;79(4):472–482. - PubMed

Publication types