. 2012;8(11):e1003055.
doi: 10.1371/journal.pgen.1003055. Epub 2012 Nov 15.

Genomic variation and its impact on gene expression in Drosophila melanogaster

Affiliations

Genomic variation and its impact on gene expression in Drosophila melanogaster

Andreas Massouras et al. PLoS Genet. 2012.

Abstract

Understanding the relationship between genetic and phenotypic variation is one of the great outstanding challenges in biology. To meet this challenge, comprehensive genomic variation maps of human as well as of model organism populations are required. Here, we present a nucleotide resolution catalog of single-nucleotide, multi-nucleotide, and structural variants in 39 Drosophila melanogaster Genetic Reference Panel inbred lines. Using an integrative, local assembly-based approach for variant discovery, we identify more than 3.6 million distinct variants, among which were more than 800,000 unique insertions, deletions (indels), and complex variants (1 to 6,000 bp). While the SNP density is higher near other variants, we find that variants themselves are not mutagenic, nor are regions with high variant density particularly mutation-prone. Rather, our data suggest that the elevated SNP density around variants is mainly due to population-level processes. We also provide insights into the regulatory architecture of gene expression variation in adult flies by mapping cis-expression quantitative trait loci (cis-eQTLs) for more than 2,000 genes. Indels comprise around 10% of all cis-eQTLs and show larger effects than SNP cis-eQTLs. In addition, we identified two-fold more gene associations in males as compared to females and found that most cis-eQTLs are sex-specific, revealing a partial decoupling of the genomic architecture between the sexes as well as the importance of genetic factors in mediating sex-biased gene expression. Finally, we performed RNA-seq-based allelic expression imbalance analyses in the offspring of crosses between sequenced lines, which revealed that the majority of strong cis-eQTLs can be validated in heterozygous individuals.


Conflict of interest statement

The authors have declared that no competing interests exist.

Figures

Figure 1
Figure 1. Overview of variants.
SNPs are shown in black/grey, insertions in red, deletions in blue, and complex variants in orange. (A) Number of base pairs affected by variants discovered per line, with lines ordered by depth of coverage (green dotted line). The line “Berkeley” is the reference line. (B) Number of unique variants by size (note that variants longer than 1,000 bp are grouped in a single x-coordinate). (C) Representation of variant density (0–10 SNPs/kb, 0–5 indels/kb, 0–5 complex variants/kb) across the euchromatic genome (concentric circles) in 50 kb bins. Large variants (>100 bp) mapping against a close homologous sequence (>90% sequence identify) are linked in the center with green lines representing intra-chromosomal- and black lines inter-chromosomal duplications. (D) Number of unique variants by number of lines.
Figure 2
Figure 2. Variants in genomic context.
(A) Density of SNPs around variant breakpoints by variant type. The dashed lines show the SNP density at the same loci but in DGRP lines that do not have the variant. (B) and (C) Density of SNPs near indels with minor allele count 2 to 4 (B) and 11 to 19 (C). The dashed lines show the SNP density at the same locus for DGRP lines without the indel. If indels were mutagenic, one would expect enrichment for low allele count SNPs near the high allele count indels; instead, the allele count of the neighboring SNPs closely matches that of the indel. (D) Density of variants (reference bases affected per Mb) in selected genomic regions. (E) Number of indels in coding regions by indel size. Insertions are in red and deletions in blue. Bars representing indel sizes that are a multiple of three are coloured dark red and blue, respectively.
Figure 3
Figure 3. Cis-associations of variants with gene expression.
(A) and (B) Variant density (blue) and significance of allele associations (red), in males around (A) the transcription start site (TSS) and (B) the transcription end site (TES) averaged out over all transcripts in a 10 kb window. The solid lines are cubic smoothing splines, fit to the data. Transcripts on both strands are orientated such that transcription takes place in the positive direction of the x-axis. The inlet in (A) corresponds to a 100 kb window length. (C) cis-eQTLs discovered in males, females, or both sexes (FDR<10%). (D) Breakdown of cis-eQTL-associated genes by sex. (E) Breakdown of cis-eQTL associated genes, discovered in males or females, by type of variant (i.e., SNP and non-SNP).
Figure 4
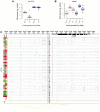
Figure 4. Examples of cis-eQTLs and their associated genes.
DGRP lines in (A) and (B) are grouped by their allele. Male and female expression levels are depicted in blue and dark pink, respectively. (A) Sex-biased cis-eQTL. A SNP (3R:8,875,391) is associated with higher gene expression levels in females only. (B) Indel-based cis-eQTLs associated with gene expression. Two insertions (7 bp, 3L:332,512; 1 bp, 3L:332,594, r2 = 0.20) are associated with markedly different expression levels in males and females. (C) cis-association overview. Plot illustrating the variant and association data for a single gene (mthl9) on a rolling window basis. The gene is shown on the top track, with UTRs in grey and coding regions in black. Significant cis-eQTLs are drawn below and color-coded by significance for each sex separately (red most significant). Linkage (r2>0.5) is shown by arcs, color-coded according to r2, with higher values in red. Rows represent all 39 DGRP lines and the left column shows gene expression levels for each line and sex separately (red indicates the highest expression level and green the lowest). The grid contains a representation of variants in rolling 50 bp windows (successive windows overlapping by 45 bp) with net insertions in red, net deletions in blue, and variants not affecting the sequence size (mostly SNPs) in black. The height of each variant indicates the net size of variants with the window, up to 20 bp. The two shaded vertical bars mark the cis-eQTLs shown in (B).
Figure 5
Figure 5. Validation of cis-associations in F1.
(A) Allelic imbalance measured for ∼7,100 transcripts in F1 (362/765 and reciprocal) with RNA-seq. Dots represent the fold-change (log2) between allele-specific reads counts. Red dots indicate transcripts with significant allelic imbalance in both crosses at a false discovery rate of 10%. Circles mark transcripts that demonstrate significant allelic imbalance and that were found to be associated with cis-eQTL in females (note that only cis-eQTLs were considered when the allele between both parental lines was not the same). (B) The proportion of cis-eQTL-associated transcripts that show allelic expression imbalance in F1s scales with the strength of the cis-eQTL (P<0.001, permutation-based, see Methods for details).

References

    1. Mackay TFC, Stone EA, Ayroles JF (2009) The genetics of quantitative traits: challenges and prospects. Nat Rev Genet 10: 565–577. - PubMed
    1. Consortium H (2010) Integrating common and rare genetic variation in diverse human populations. Nature 467: 52–58. - PMC - PubMed
    1. Mills RE, Walter K, Stewart C, Handsaker RE, Chen K, et al. (2011) Mapping copy number variation by population-scale genome sequencing. Nature 470: 59–65. - PMC - PubMed
    1. Keane TM, Goodstadt L, Danecek P, White MA, Wong K, et al. (2011) Mouse genomic variation and its effect on phenotypes and gene regulation. Nature 477: 289–294. - PMC - PubMed
    1. Gan X, Stegle O, Behr J, Steffen JG, Drewe P, et al. (2011) Multiple reference genomes and transcriptomes for Arabidopsis thaliana. Nature 477: 419–423. - PMC - PubMed

Publication types

LinkOut - more resources