. 2012 Nov 22:6:91.
doi: 10.3389/fncir.2012.00091. eCollection 2012.

Olivary subthreshold oscillations and burst activity revisited

Affiliations

Olivary subthreshold oscillations and burst activity revisited

Paolo Bazzigaluppi et al. Front Neural Circuits. .

Abstract

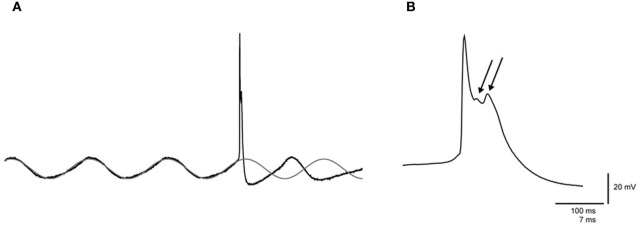
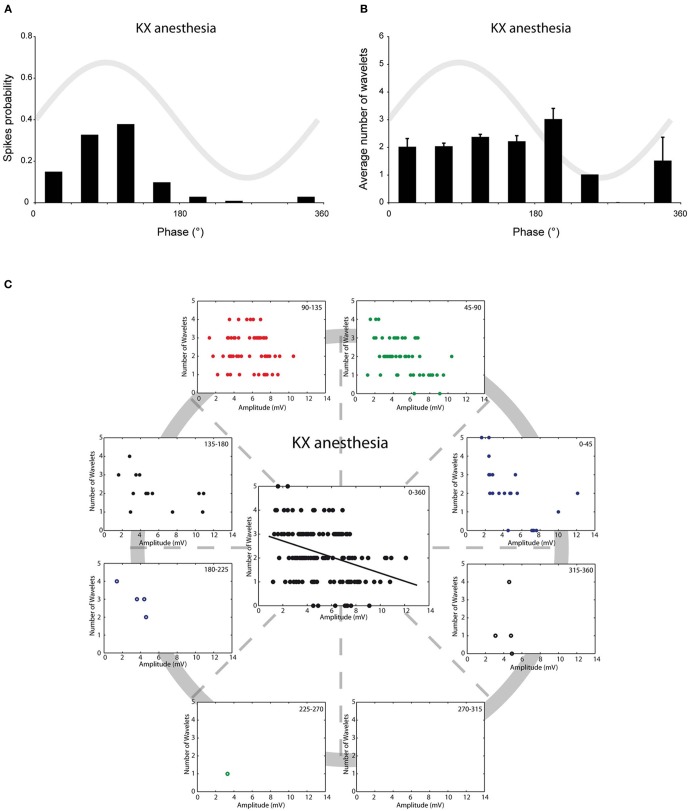
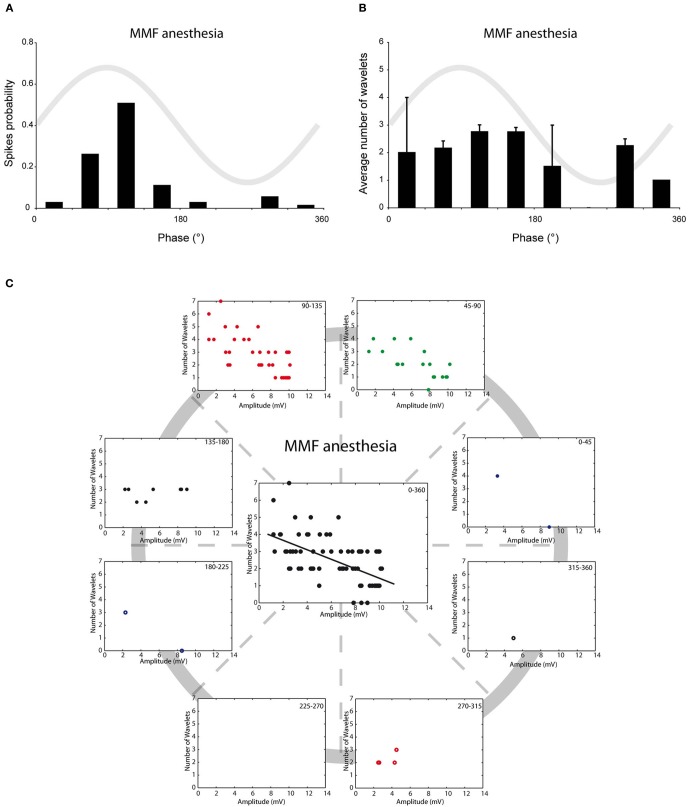
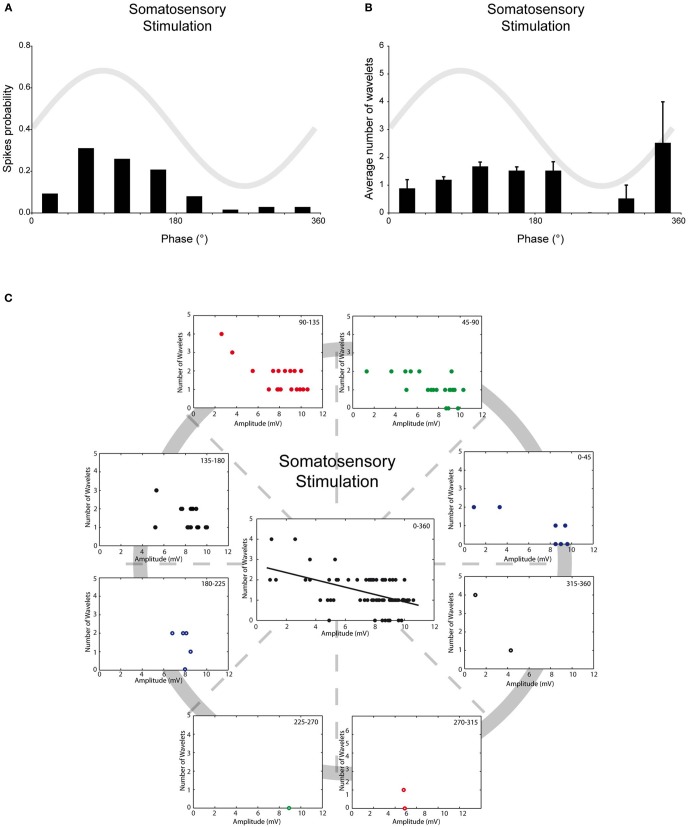
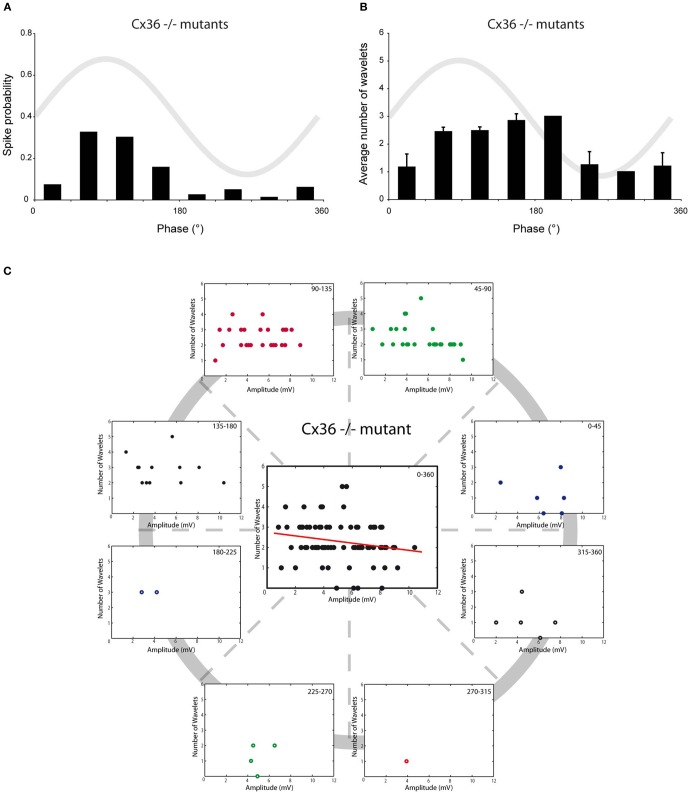
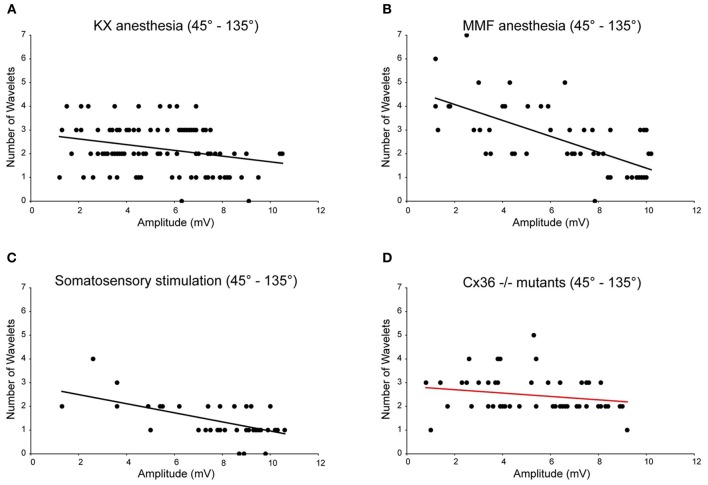
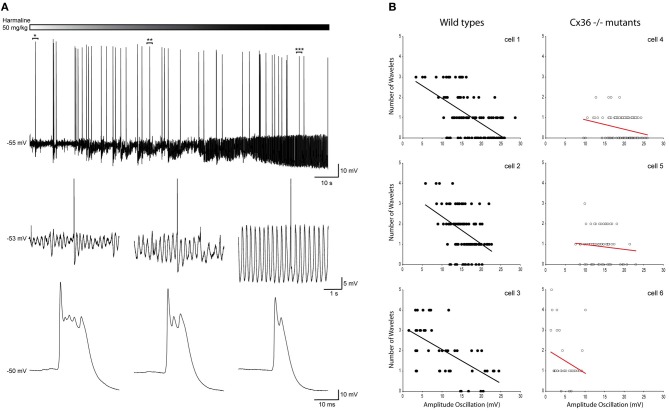
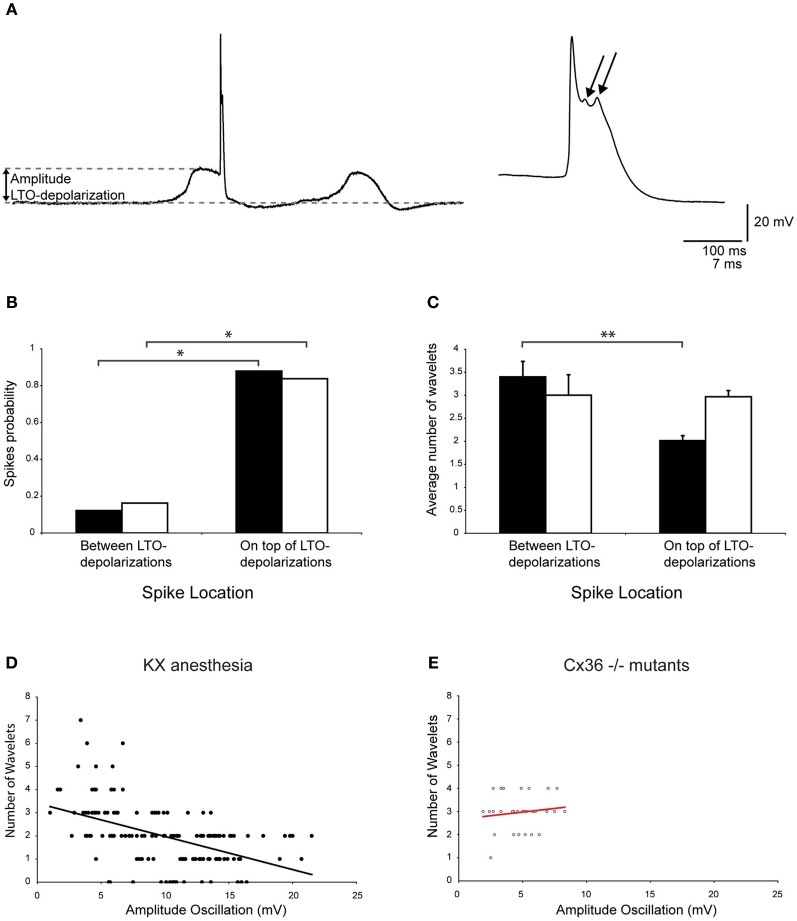
The inferior olive (IO) forms one of the major gateways for information that travels to the cerebellar cortex. Olivary neurons process sensory and motor signals that are subsequently relayed to Purkinje cells. The intrinsic subthreshold membrane potential oscillations of the olivary neurons are thought to be important for gating this flow of information. In vitro studies have revealed that the phase of the subthreshold oscillation determines the size of the olivary burst and may gate the information flow or encode the temporal state of the olivary network. Here, we investigated whether the same phenomenon occurred in murine olivary cells in an intact olivocerebellar system using the in vivo whole-cell recording technique. Our in vivo findings revealed that the number of wavelets within the olivary burst did not encode the timing of the spike relative to the phase of the oscillation but was related to the amplitude of the oscillation. Manipulating the oscillation amplitude by applying Harmaline confirmed the inverse relationship between the amplitude of oscillation and the number of wavelets within the olivary burst. Furthermore, we demonstrated that electrotonic coupling between olivary neurons affect this modulation of the olivary burst size. Based on these results, we suggest that the olivary burst size might reflect the "expectancy" of a spike to occur rather than the spike timing, and that this process requires the presence of gap junction coupling.

Keywords: cerebellum; climbing fiber; gap junctions; inferior olive; subthreshold oscillations; wavelets.


Figures

Figure 1
Figure 1
Spontaneous sinusoidal subthreshold oscillations and wavelets of an olivary neuron. (A) Left panel: trace of a spontaneous sinusoidal subthreshold oscillation (SSTO) from an olivary neuron in vivo. The gray trace indicates the sinusoidal fit of the SSTO prior to the occurrence of the action potential, followed by an extrapolation after the occurrence of the action potential. (B) Right panel: enlargement of the olivary action potential shown in the left panel. The arrows indicate the olivary wavelets on top of the afterdepolarization (ADP).
Figure 2
Figure 2
Burst size of olivary wavelets and SSTOs under KX anaesthesia. (A) The occurrence of spontaneous spikes (spike probability) in relation to the phase of the SSTO obtained from olivary neurons recorded under KX anaesthesia (n = 155). (B) Average number of wavelets on the ADP of spontaneous spikes in relation to the phase of the SSTO obtained from olivary neurons recorded under KX anaesthesia (n = 155). (C) Relationship between number of wavelets and amplitude of SSTO were plotted for each phase-bin. The center graph shows the correlation between the amplitude of the SSTOs and the number of wavelets of all data (all phase-bins together) measured under KX anaesthesia. Least squares linear regression lines and correlation coefficients were computed [rKX = −0.36, n = 155, and p < 0.01 (t-test)].
Figure 3
Figure 3
Burst size of olivary wavelets and SSTOs under MMF anaesthesia. (A) The occurrence of spontaneous spikes (spike probability) in relation to the phase of the SSTO obtained from olivary neurons recorded under MMF anaesthesia (n = 73). (B) Average number of wavelets on the ADP of spontaneous spikes in relation to the phase of the SSTO obtained from olivary neurons recorded under MMF anaesthesia (n = 73). (C) Relationship between number of wavelets and amplitude of SSTO were plotted for each phase-bin. The center graph shows the correlation between the amplitude of the SSTOs and the number of wavelets of all data (all phase-bins together) measured under MMF anaesthesia. Least squares linear regression lines and correlation coefficients were computed [rMMF = −0.58, n = 73, and p < 0.01 (t-test)].
Figure 4
Figure 4
Burst size of olivary wavelets and SSTOs of somatosensory-evoked spikes. (A) The occurrence of stimulus evoked spikes (spike probability) in relation to the phase of the SSTO obtained from olivary neurons recorded under KX anaesthesia (n = 78). (B) Average number of wavelets on the ADP of stimulus evoked spikes in relation to the phase of the SSTO obtained from olivary neurons recorded under KX anaesthesia (n = 78). (C) Relationship between number of wavelets and amplitude of SSTO were plotted for each phase-bin. The center graph shows the correlation between the amplitude of the SSTOs and the number of wavelets of all data (all phase-bins together) measured on somatosensory evoked spikes. Least squares linear regression lines and correlation coefficients were computed [rSSS = −0.49, n = 78, and p < 0.01 (t-test)].
Figure 5
Figure 5
Burst size of olivary wavelets and SSTOs in Cx36−/− mutants. (A) The occurrence of spontaneous spikes (spike probability) in relation to the phase of the SSTO obtained from olivary neurons recorded in Cx36−/− mutants (n = 83). (B) Average number of wavelets on the ADP of spontaneous spikes in relation to the phase of the SSTO obtained from olivary neurons recorded in Cx36−/− mutants (n = 83). (C) Relationship between number of wavelets and amplitude of SSTO were plotted for each phase-bin. The center graph shows the correlation between the amplitude of the SSTOs and the number of wavelets of all data (all phase-bins together) measured in Cx36−/− mutant mice. Least squares linear regression lines and correlation coefficients were computed [rCX36 = −0.20, n = 83, and p > 0.05 (t-test)].
Figure 6
Figure 6
Burst size of olivary wavelets during the peak phase (45–135°) of the SSTOs. Relationships between number of wavelets and amplitude of SSTO were plotted of spikes that occur during the peak phase (45–135°) of the SSTOs. Least squares linear regression lines and correlation coefficients were computed for all four conditions (KX anesthesia, MMF anesthesia, somatosensory-evoked action potentials and Cx36−/−). Amplitude of the oscillation and number of olivary spike wavelets are significantly correlated under KX conditions [A; rKX = −0.27, n = 110 (71%), p < 0.01 (t-test)] and under MMF conditions [B; rMMF = −0.67, n = 56 (77%), p < 0.01 (t-test)]. Amplitude of the oscillation and number of olivary spike wavelets are significantly correlated when measured on somatosensory evoked spikes [C; rSSS = −0.55, n = 44 (56%), p < 0.01 (t-test)] and are not significantly correlated when measured in Cx36−/− mutant mice [D; rCX36 = −0.21, n = 53 (64%), p > 0.05 (t-test)].
Figure 7
Figure 7
Harmaline induced alteration of the oscillation amplitude confirms the negative relationship between the amplitude of the SSTOs and the number of wavelets on the ADP of olivary spikes within a single cell. (A) Top panel: trace of a spontaneous sinusoidal subthreshold oscillating olivary neuron (in vivo) during the application of harmaline. Middle panel: three magnifications obtained from the trace above. Magnifications were taken from the marked time windows (*, **, and ***) and show the effect of harmaline on the subhreshold oscillation. Lower panel: enlargement of the olivary action potential shown in the panel above. The number of the olivary wavelets on top of the afterdepolarization declines, while the amplitude of the oscillation increases. (B) Correlation between the amplitude of the SSTOs and the number of wavelets on the ADP of olivary spikes measured in cells from wild type (left panel) and from Cx36−/− mutant mice (right panel). Least squares linear regression lines and correlation coefficients were computed from each cell. Wild types (left panel) cell 1: r = −0.59, n = 116, and p < 0.01 (t-test); cell 2: r = −0.55, n = 143, and p < 0.01 (t-test); cell 3: r = −0.63, n = 46, and p < 0.01 (t-test). Cx36−/− mutants (right panel) cell 4: r = −0.04, n = 223, and p > 0.05 (t-test); cell 5: r = −0.14, n = 74, and p > 0.05 (t-test); cell 6: r = −0.23, n = 35, and p > 0.05 (t-test).
Figure 8
Figure 8
Modulation of olivary wavelets by low-threshold Ca2+ depolarizations. (A) Left panel: trace of a spontaneous low-threshold Ca2+ depolarizations from an in vivo olivary neuron. The gray dashed lines indicate the amplitude of the low-threshold Ca2+ depolarization. Right panel: enlargement of the olivary action potential shown in the left panel. The arrows indicate the olivary wavelets on top of the afterdepolarization. (B) The occurrence of spikes (spike probability) in relation to spike position relative to the low-threshold Ca2+ oscillations obtained from recordings measured from either wild type (black bars, n = 165) or Cx36−/− mutant mice (open bars, n = 37). *p < 0.05 (χ2-test). (C) Average number of wavelets on the ADP of olivary spikes in relation to spike position relative to the low-threshold Ca2+ oscillations obtained from recordings measured from either wild type (black bars, n = 165) or Cx36−/− mutant mice (open bars, n = 37). **p < 0.01 (t-test). (D,E) Correlation between the amplitude of the LTOs and the number of wavelets on the ADP of olivary spikes measured under KX anaesthesia (D) in wild type and Cx36−/− mutant mice (E). Least squares linear regression lines and correlation coefficients were computed from each data set. KX anaesthesia: r = −0.51, n = 145, and p < 0.01 (t-test); Cx36−/− mutants: r = 0.14, n = 31, and p > 0.05 (t-test).

Similar articles

Cited by

References

    1. Andersson G., Armstrong D. M. (1987). Complex spikes in Purkinje cells in the lateral vermis (b zone) of the cat cerebellum during locomotion. J. Physiol. 385, 107–134 - PMC - PubMed
    1. Bracha V., Zbarska S., Parker K., Carrel A., Zenitsky G., Bloedel J. R. (2009). The cerebellum and eye-blink conditioning: learning versus network performance hypotheses. Neuroscience 162, 787–796 10.1016/j.neuroscience.2008.12.042 - DOI - PMC - PubMed
    1. Choi S., Yu E., Kim D., Urbano F. J., Makarenko V., Shin H. S., et al. (2010). Subthreshold membrane potential oscillations in inferior olive neurons are dynamically regulated by P/Q- and T-type calcium channels: a study in mutant mice. J. Physiol. 588, 3031–3043 10.1113/jphysiol.2009.184705 - DOI - PMC - PubMed
    1. Chorev E., Yarom Y., Lampl I. (2007). Rhythmic episodes of subthreshold membrane potential oscillations in the rat inferior olive nuclei in vivo. J. Neurosci. 27, 5043–5052 10.1523/JNEUROSCI.5187-06.2007 - DOI - PMC - PubMed
    1. Crill W. E. (1970). Unitary multiple-spiked responses in cat inferior olive nucleus. J. Neurophysiol. 33, 199–209 - PubMed