. 2012 Nov 23:3:439.
doi: 10.3389/fphys.2012.00439. eCollection 2012.

Is central dogma a global property of cellular information flow?

Affiliations

Is central dogma a global property of cellular information flow?

Vincent Piras et al. Front Physiol. .

Abstract

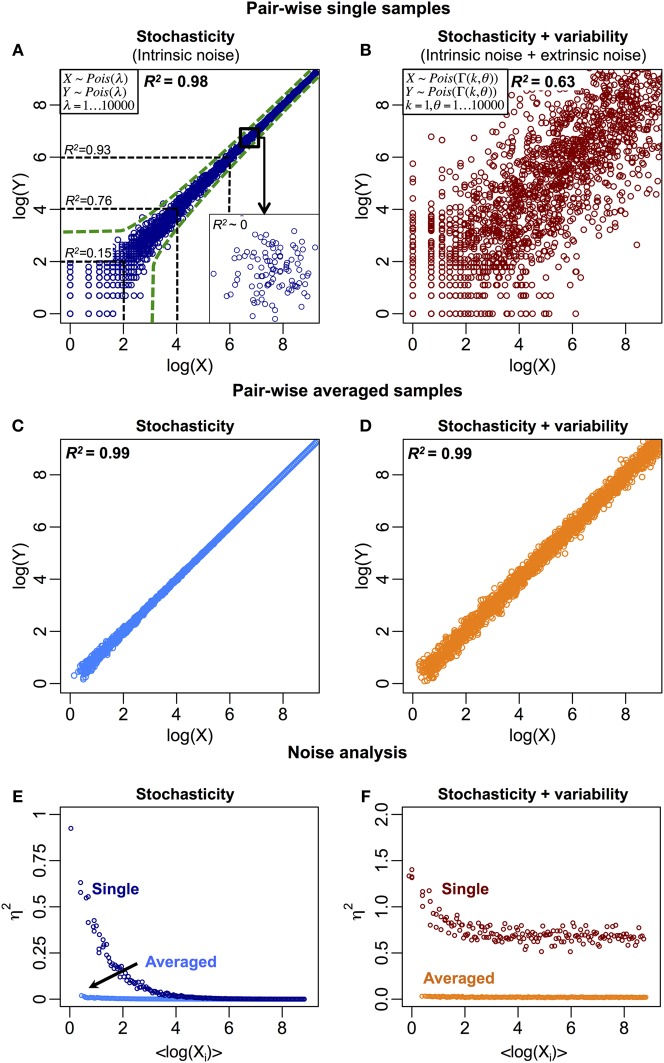
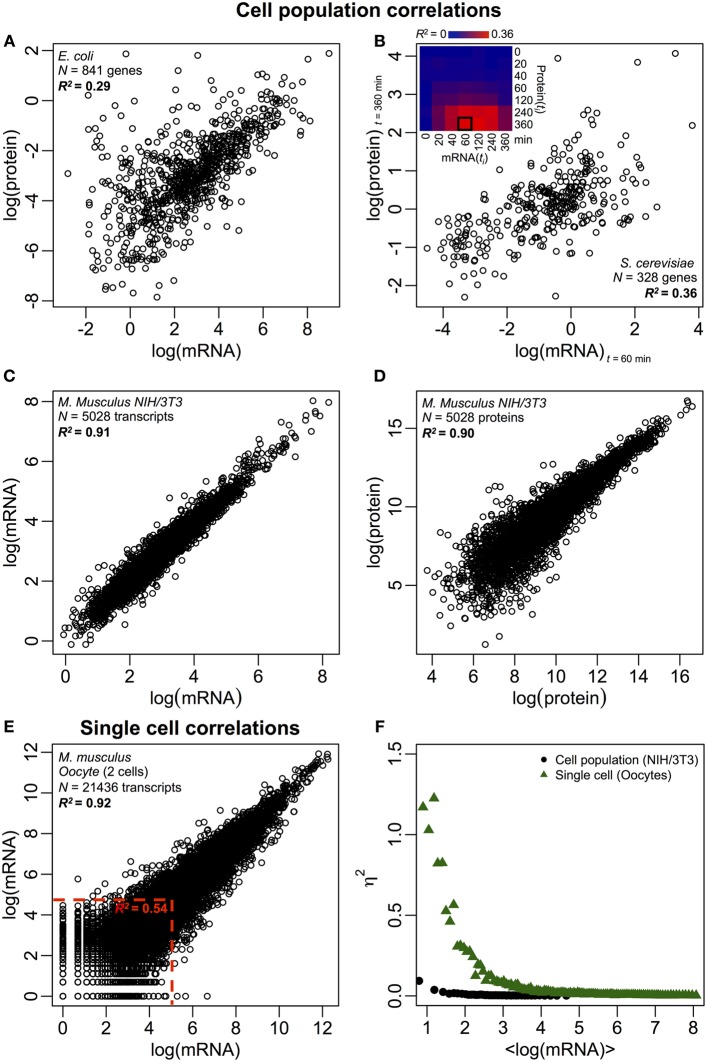
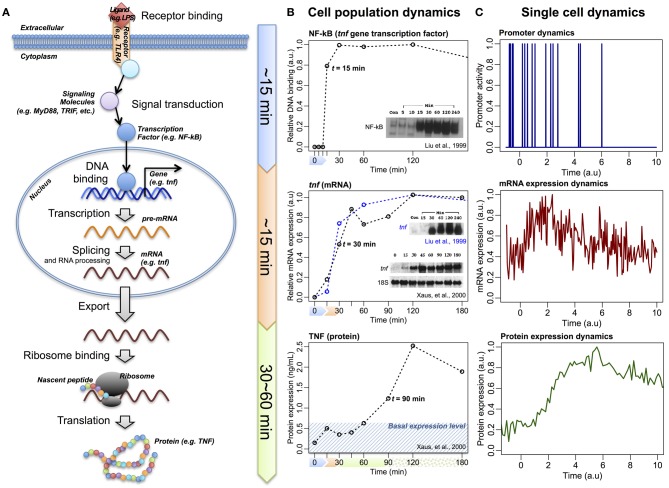
The central dogma of molecular biology has come under scrutiny in recent years. Here, we reviewed high-throughput mRNA and protein expression data of Escherichia coli, Saccharomyces cerevisiae, and several mammalian cells. At both single cell and population scales, the statistical comparisons between the entire transcriptomes and proteomes show clear correlation structures. In contrast, the pair-wise correlations of single transcripts to proteins show nullity. These data suggest that the organizing structure guiding cellular processes is observed at omics-wide scale, and not at single molecule level. The central dogma, thus, globally emerges as an average integrated flow of cellular information.

Keywords: biological noise; central dogma; correlation analysis; emergent behavior; gene expression.


Figures

Figure 1
Figure 1
Biological and non-biological noise reduce the between samples correlation structure. (A) Stochastic fluctuations reduce correlations, especially for low copy number of molecular species (R2 ~0.15 for log(X) < 2). The green dotted lines represent the intrinsic noise region generated by Poisson process (Raj and van Oudenaarden, 2009). Insert: the correlation structure disappears when zooming at smaller or single molecule scale. (B) Stochastic fluctuations (intrinsic) on variable (extrinsic) noise further reduce the overall correlation structure. Variable noise is represented by a Gamma distribution (Taniguchi et al., 2010). R2 is obtained by squaring the Pearson product-moment correlation coefficient, R=r(X,Y)=i=1N(xiμX)(yiμY)/i=1N(xiμX)2i=1N(yiμY)2, where X = (x1, …, xi, …, xN) and Y = (y1, …, yi, …, yN) are 2 N-dimensional variables, xi and yi are the ith observation (i = 1, …, N) of X and Y respectively. μX and μY are the statistical means of the two variables. (C) Stochastic and (D) total (stochastic and variable) noise reduce when single samples are averaged into population. (E) and (F) show noise, η2 = σ2XY2XY, versus <log(Xi)> for (C) and (D), respectively, where σXY=12Pj=1P(xi,jyi,j)2,μXY=12Pj=1P(xi,jyi,j) (Jones and Payne, 1997), and the jth element of vectors Xi = (xi, 1, …, xi,j, …, xi,P) and Yi = (yi, 1, …, yi,j, …, yi,P) is the expression of the ith gene in the jth sample for (P = 100) pairs of samples. In (F), at higher expressions for single cells, the remaining noise represents the extrinsic or variable noise. At averaged population scale, this noise is significantly reduced due to the effect of random noise cancellation.
Figure 2
Figure 2
Omics-wide expression correlations. Cell populations: mRNA-protein correlations in (A) E. coli (Taniguchi et al., 2010) and (B) S. cerevisiae (Fournier et al., 2010) between mRNA expressions at t = 60 min and protein expressions at t = 360 min. Insert: correlation matrix between all time points shows a delayed increase in correlations between mRNA and proteins. (C) mRNA and (D) protein expressions between two samples of murine NIH/3T3 cells (Schwanhäusser et al., 2011). Single cells: (E) mRNA expressions between two oocytes (Tang et al., 2009). The red dotted lines indicate the regions of low mRNA expressions (log(mRNA) < 5). (F) Noise (η2) versus log(mRNA expressions) for cell population (NIH/3T3, black dots, Schwanhäusser et al., 2011) and single cells (Oocytes, green triangles, Tang et al., 2009). Each dot represents the value for a group of P = 100 mRNAs. η2 is near zero for the cell population for all mRNA expressions. For single cells, η2 is highest for mRNAs with the lowest copy numbers, and approaches zero for higher copy numbers.
Figure 3
Figure 3
The information flow of central dogma. (A) Schematic of LPS/TLR4-induced TNF expression, via transcription factor NF-κB and tnf gene, following linear information flow. (B) Experimental temporal profiles of promoter binding activity of NF-κB (upper panels), tnf (middle panels), and TNF (lower panels) expressions at cell population level. (C) Schematic temporal profiles of promoter dynamics, mRNA, and protein expressions at single-cell level (Raj and van Oudenaarden, 2009).

References

    1. Amati L., Guidorzi C., Frontera F., Della Valle K., Finelli F., Landi R., et al. (2008). Measuring the cosmological parameters with the Ep, i-Eiso correlation of Gamma-Ray Bursts. Mon. Not. R. Astron. Soc. 391, 577–584
    1. Barabási A. L., Oltvai Z. N. (2004). Network biology: understanding the cell's functional organization. Nat. Rev. Genet. 5, 101–113 10.1038/nrg1272 - DOI - PubMed
    1. Brandão A. R., Barbosa H. S., Arruda M. A. (2010). Image analysis of two-dimensional gel electrophoresis for comparative proteomics of transgenic and non-transgenic soybean seeds. J. Proteomics 73, 1433–1440 10.1016/j.jprot.2010.01.009 - DOI - PubMed
    1. Chang H. H., Hemberg M., Barahona M., Ingber D. E., Huang S. (2008). Transcriptome-wide noise controls lineage choice in mammalian progenitor cells. Nature 453, 544–547 10.1038/nature06965 - DOI - PMC - PubMed
    1. Crick F. (1958). On protein synthesis. Symp. Soc. Exp. Biol. 12, 139–163 - PubMed

LinkOut - more resources