Mitochondrial localization of ABC transporter ABCG2 and its function in 5-aminolevulinic acid-mediated protoporphyrin IX accumulation
- PMID: 23189181
- PMCID: PMC3506543
- DOI: 10.1371/journal.pone.0050082
Mitochondrial localization of ABC transporter ABCG2 and its function in 5-aminolevulinic acid-mediated protoporphyrin IX accumulation
Abstract
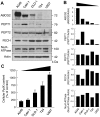
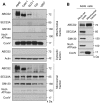
Accumulation of protoporphyrin IX (PpIX) in malignant cells is the basis of 5-aminolevulinic acid (ALA)-mediated photodynamic therapy. We studied the expression of proteins that possibly affect ALA-mediated PpIX accumulation, namely oligopeptide transporter-1 and -2, ferrochelatase and ATP-binding cassette transporter G2 (ABCG2), in several tumor cell lines. Among these proteins, only ABCG2 correlated negatively with ALA-mediated PpIX accumulation. Both a subcellular fractionation study and confocal laser microscopic analysis revealed that ABCG2 was distributed not only in the plasma membrane but also intracellular organelles, including mitochondria. In addition, mitochondrial ABCG2 regulated the content of ALA-mediated PpIX in mitochondria, and Ko143, a specific inhibitor of ABCG2, enhanced mitochondrial PpIX accumulation. To clarify the possible roles of mitochondrial ABCG2, we characterized stably transfected-HEK (ST-HEK) cells overexpressing ABCG2. In these ST-HEK cells, functionally active ABCG2 was detected in mitochondria, and treatment with Ko143 increased ALA-mediated mitochondrial PpIX accumulation. Moreover, the mitochondria isolated from ST-HEK cells exported doxorubicin probably through ABCG2, because the export of doxorubicin was inhibited by Ko143. The susceptibility of ABCG2 distributed in mitochondria to proteinase K, endoglycosidase H and peptide-N-glycosidase F suggested that ABCG2 in mitochondrial fraction is modified by N-glycans and trafficked through the endoplasmic reticulum and Golgi apparatus and finally localizes within the mitochondria. Thus, it was found that ABCG2 distributed in mitochondria is a functional transporter and that the mitochondrial ABCG2 regulates ALA-mediated PpIX level through PpIX export from mitochondria to the cytosol.
Conflict of interest statement
Figures


Similar articles
-
Serum-dependent export of protoporphyrin IX by ATP-binding cassette transporter G2 in T24 cells.Mol Cell Biochem. 2011 Dec;358(1-2):297-307. doi: 10.1007/s11010-011-0980-5. Epub 2011 Jul 12. Mol Cell Biochem. 2011. PMID: 21748335
-
Effectiveness of lapatinib for enhancing 5-aminolevulinic acid-mediated protoporphyrin IX fluorescence and photodynamic therapy in human cancer cell lines with varied ABCG2 activities.Photochem Photobiol. 2024 Nov-Dec;100(6):1579-1589. doi: 10.1111/php.13936. Epub 2024 Mar 13. Photochem Photobiol. 2024. PMID: 38477138
-
Inhibition of ABCG2 transporter by lapatinib enhances 5-aminolevulinic acid-mediated protoporphyrin IX fluorescence and photodynamic therapy response in human glioma cell lines.Biochem Pharmacol. 2022 Jun;200:115031. doi: 10.1016/j.bcp.2022.115031. Epub 2022 Apr 4. Biochem Pharmacol. 2022. PMID: 35390338 Free PMC article.
-
Targeting ABCG2 transporter to enhance 5-aminolevulinic acid for tumor visualization and photodynamic therapy.Biochem Pharmacol. 2023 Nov;217:115851. doi: 10.1016/j.bcp.2023.115851. Epub 2023 Oct 17. Biochem Pharmacol. 2023. PMID: 37858868 Free PMC article. Review.
-
Critical role of ABCG2 in ALA-photodynamic diagnosis and therapy of human brain tumor.Adv Cancer Res. 2015;125:197-216. doi: 10.1016/bs.acr.2014.11.008. Epub 2015 Jan 8. Adv Cancer Res. 2015. PMID: 25640271 Review.
Cited by
-
Analysis of Factors Affecting 5-ALA Fluorescence Intensity in Visualizing Glial Tumor Cells-Literature Review.Int J Mol Sci. 2022 Jan 15;23(2):926. doi: 10.3390/ijms23020926. Int J Mol Sci. 2022. PMID: 35055109 Free PMC article. Review.
-
From cholesterogenesis to steroidogenesis: role of riboflavin and flavoenzymes in the biosynthesis of vitamin D.Adv Nutr. 2014 Mar 1;5(2):144-63. doi: 10.3945/an.113.005181. Adv Nutr. 2014. PMID: 24618756 Free PMC article. Review.
-
5-Aminolevulinic acid (5-ALA) in paediatric brain tumour surgery-a systematic review and exploration of fluorophore alternatives.Childs Nerv Syst. 2025 Apr 3;41(1):150. doi: 10.1007/s00381-025-06810-8. Childs Nerv Syst. 2025. PMID: 40178625
-
In order for the light to shine so brightly, the darkness must be present-why do cancers fluoresce with 5-aminolaevulinic acid?Br J Cancer. 2019 Oct;121(8):631-639. doi: 10.1038/s41416-019-0516-4. Epub 2019 Aug 13. Br J Cancer. 2019. PMID: 31406300 Free PMC article. Review.
-
Endoplasmic Reticulum-Mitochondria Contacts: A Potential Therapy Target for Cardiovascular Remodeling-Associated Diseases.Front Cell Dev Biol. 2021 Nov 10;9:774989. doi: 10.3389/fcell.2021.774989. eCollection 2021. Front Cell Dev Biol. 2021. PMID: 34858991 Free PMC article. Review.
References
-
- Yavari N, Andersson-Engels S, Segersten U, Malmstrom PU (2011) An overview on preclinical and clinical experiences with photodynamic therapy for bladder cancer. Can J Urol 18: 5778–5786. - PubMed
-
- Ishizuka M, Abe F, Sano Y, Takahashi K, Inoue K, et al. (2011) Novel development of 5-aminolevurinic acid (ALA) in cancer diagnoses and therapy. Int Immunopharmacol 11: 358–365. - PubMed
-
- Krieg RC, Messmann H, Rauch J, Seeger S, Knuechel R (2002) Metabolic characterization of tumor cell-specific protoporphyrin IX accumulation after exposure to 5-aminolevulinic acid in human colonic cells. Photochem Photobiol 76: 518–525. - PubMed
-
- Amo T, Kawanishi N, Uchida M, Fujita H, Oyanagi E, et al. (2009) Mechanism of cell death by 5-aminolevulinic acid-based photodynamic action and its enhancement by ferrochelatase inhibitors in human histiocytic lymphoma cell line U937. Cell Biochem Funct 27: 503–515. - PubMed
-
- Peng Q, Warloe T, Berg K, Moan J, Kongshaug M, et al. (1997) 5-Aminolevulinic acid-based photodynamic therapy. Clinical research and future challenges. Cancer 79: 2282–2308. - PubMed
Publication types
MeSH terms
Substances
LinkOut - more resources
Full Text Sources
Other Literature Sources
Molecular Biology Databases
Miscellaneous

