. 2012;7(11):e50238.
doi: 10.1371/journal.pone.0050238. Epub 2012 Nov 26.

Burn injury triggered dysfunction in dendritic cell response to TLR9 activation and resulted in skewed T cell functions

Affiliations

Burn injury triggered dysfunction in dendritic cell response to TLR9 activation and resulted in skewed T cell functions

Haitao Shen et al. PLoS One. 2012.

Abstract

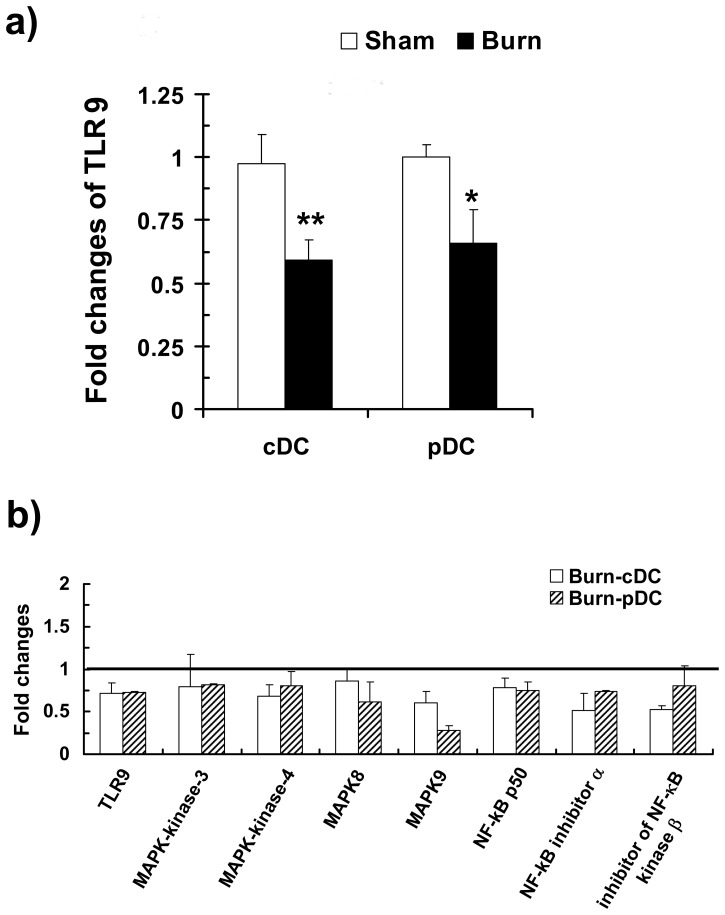
Severe trauma such as burn injury is often associated with a systemic inflammatory syndrome characterized by a hyperactive innate immune response and suppressed adaptive immune function. Dendritic cells (DCs), which sense pathogens via their Toll-like receptors (TLRs), play a pivotal role in protecting the host against infections. The effect of burn injury on TLR-mediated DC function is a debated topic and the mechanism controlling the purported immunosuppressive response remains to be elucidated. Here we examined the effects of burn injury on splenic conventional DC (cDC) and plasmacytoid DC (pDC) responses to TLR9 activation. We demonstrate that, following burn trauma, splenic cDCs' cytokine production profile in response to TLR9 activation became anti-inflammatory dominant, with high production of IL-10 (>50% increase) and low production of IL-6, TNF-α and IL-12p70 (∼25-60% reduction). CD4+ T cells activated by these cDCs were defective in producing Th1 and Th17 cytokines. Furthermore, burn injury had a more accentuated effect on pDCs than on cDCs. Following TLR9 activation, pDCs displayed an immature phenotype with an impaired ability to secrete pro-inflammatory cytokines (IFN-α, IL-6 and TNF-α) and to activate T cell proliferation. Moreover, cDCs and pDCs from burn-injured mice had low transcript levels of TLR9 and several key molecules of the TLR signaling pathway. Although hyperactive innate immune response has been associated with severe injury, our data show to the contrary that DCs, as a key player in the innate immune system, had impaired TLR9 reactivity, an anti-inflammatory phenotype, and a dysfunctional T cell-priming ability. We conclude that burn injury induced impairments in DC immunobiology resulting in suppression of adaptive immune response. Targeted DC immunotherapies to promote their ability in triggering T cell immunity may represent a strategy to improve immune defenses against infection following burn injury.


Conflict of interest statement

Competing Interests: The authors have declared that no competing interests exist.

Figures

Figure 1
Figure 1. Reduced numbers and percentages of splenic cDCs and pDCs following burn injury.
Mice were subjected to non-lethal thermal injury and total splenocytes were purified and stained using antibodies for distinct surface markers. The effect of burn injury on each DC subset was examined. (a) A representative FACS plot demonstrating the percentages of splenic cDCs (CD11chiB220neg) and CD11clowB220+ DC subpopulations at d3 post-injury in comparison to sham. The CD11clowB220+ population comprises of pDCs (CD11clowB220+PDCA1+) and IKDCs (CD11clowB220+DX5+). Percentages of CD11chiB220neg cDCs and CD11clowB220+ DCs are shown as mean ± SEM (n = 9, 3 independent experiments). Percentages (b) and absolute numbers (c) of splenic cDCs, pDCs and IKDCs at various time points post burn and sham injury are shown. Data are shown as mean ± SEM (n = 9, 3 independent experiments). *P<0.05; **p<0.01, sham versus burn by ANOVA.
Figure 2
Figure 2. Absolute counts of infiltrating DCs recruited to the burn and sham injury site.
Three days post burn injury, the skin specimens of burn and sham injury (2 cm×2 cm) were harvested and digested in Dispase II and collagenase D. Cells were isolated and stained for CD11c+ for DCs followed by flow cytometry analysis. Absolute numbers of infiltrating CD11c+ DCs are shown as mean ± SEM (n = 8, 4 independent experiments).
Figure 3
Figure 3. Burn injury impaired TLR9-induced cDC maturation.
Three days post-injury, total splenic CD11c+ DCs were activated with or without CpG (24 hr) and stained for CD11c, B220, CD80, CD86 and MHC II. CDCs were gated as CD11chiB220 and the expression of CD80, CD86 and MHC II were analyzed by flow cytometry. (a) Representative FACS plots of non-activated (left) and TLR9-activated (right) cDCs of burn and sham mice. Percentages of mature cDCs (MHCIIhiCD80hiCD86hi) are shown as mean ± SEM (n = 9, 3 independent experiments). (b) Percentages of MHCIIhiCD80hiCD86hi mature cDCs and (c) mean fluorescence intensity (MFI) of MHC-II, CD80 and CD86 expression on cDCs with and without TLR9 activation are shown as mean ± SEM (n = 9, 3 independent experiments). *P<0.05; **p<0.01, sham versus burn by ANOVA.
Figure 4
Figure 4. Reduced TLR9-mediated DC maturation following burn injury.
Total splenic CD11c+ DCs were purified at different time point post-burn/sham injury and subjected to CpG activation. TLR-activated cells were stained for CD11c, B220, PDCA1, CD80, CD86 and MHC II expression and CDCs were gated as CD11chiB220 and pDCs as CD11clowB220+PDCA1+. Percentages of MHCIIhiCD80hiCD86hi mature cDCs (a) and pDCs (b), as well as MFI of MHC-II expression on cDCs (a) and pDCs (b) are shown as mean ± SEM (n >9, 3–5 independent experiments). *P<0.05, **p<0.01, sham versus burn by ANOVA.
Figure 5
Figure 5. Splenic pDCs of burn-injured mice had a diminished ability to undergo maturation following TLR9 activation.
Splenic DCs were enriched on d3 after injury, activated with or without CpG (40 hr) then stained for CD11c, B220, CD80, CD86 and MHC II. PDCs were gated as CD11clowB220+PDCA1+ and the expression of CD80, CD86 and MHC II were analyzed by flow cytometry. (a) Representative FACS plots of non-activated and TLR9-activated pDCs of burn and sham mice. Percentages of mature pDCs (MHCIIhiCD80hiCD86hi) are shown as mean ± SEM (n = 9, 3 independent experiments). (b) Percentages of MHCIIhiCD80hiCD86hi mature pDCs and (c) MFI of MHC II, CD80, and CD86 expression on pDCs with and without TLR9 activation are shown as mean ± SEM (n = 9, 3 independent experiments). *P<0.05, **p<0.01, sham versus burn by ANOVA.
Figure 6
Figure 6. Burn injury had no impact on the ability of cDCs to stimulate Ag-specific T cell proliferation.
Three days post-burn/sham injury, FACS-sorted cDCs were pulsed with either OVA323-229 class II or HA class I-restricted peptides (concentration ranging from 0.01 to 1 µg/ml) and activated with CpG (6 µg/ml, 18–20 hr). DCs were then washed and subsequently co-cultured with CFSE-labeled CD4+ and CD8+ T cells for three consecutive days. Proliferation of (a) CD4+ and (b) CD8+ TCR-transgenic T cells is illustrated by means of CFSE dilution measured using flow cytometry. Representative FACS plots with percentages of unproliferated cells are shown (n = 9, 3 independent experiments).
Figure 7
Figure 7. CDCs from burn-injured mice had an impaired ability to trigger Th1 and Th17 CD4+ T cell responses.
FACS-sorted cDCs were isolated on d3 post injury, pulsed with OVA323-229 class II-restricted peptide (0.01 µg/ml to 0.1 µg/ml), then activated with CpG (6 µg/ml, 18–20 hr). CD4+ T cells were subsequently co-cultured with the washed, activated cDCs for three days. Cytokines production was measured as pg/ml in supernatants by cytometric bead analysis assay. Data represent mean ± SEM (n = 9, 3 independent experiments). *P<0.05, sham versus burn by ANOVA.
Figure 8
Figure 8. Burn injury impaired splenic cDCs’ ability to secrete pro-inflammatory cytokines upon TLR9 activation.
Three days post-injury, FACS-sorted cDCs with purity >98% were activated with CpG (6 µg/ml, 18–20 hr). Pro-inflammatory cytokine production by TLR9-activated cDCs was measured by cytometry bead analysis (CBA) assay. Data represent mean ± SEM (n = 6, 3 independent experiments). *P<0.05; **p<0.01, sham versus burn by ANOVA.
Figure 9
Figure 9. TLR9-activated pDCs from burn-injured mice had a reduced ability to activate CD4+ and CD8+ T cell proliferation.
Three days post-injury, FACS-sorted splenic pDCs were pulsed with either OVA323-229 class II or HA class I-restricted peptides (concentration ranging from 0.1 to 10 µg/ml) and activated with CpG (6 µg/ml, 18–20 hr). CFSE-labeled OVA-specific CD4+ and HA-specific CD8+ T cells were co-cultured with the washed, activated pDCs for three consecutive days. Proliferation of (a) CD4+ and (b) CD8+ TCR-transgenic T cells is illustrated by means of CFSE dilution measured using flow cytometry. Representative FACS plots are shown and percentages of unproliferated cells were gated (n = 9, 3 independent experiments).
Figure 10
Figure 10. PDCs from burn-injured mice had an impaired ability to secrete pro-inflammatory cytokines.
Three days post-injury, FACS-sorted spleen pDCs with purity >98% were activated with CpG (18–20 hr). Inflammatory cytokines and IFN-α productions by TLR9-activated pDCs were measured by CBA assay and ELISA, respectively. Data are shown as mean ± SEM (n = 8, 4 independent experiments). *P<0.05, sham versus burn by ANOVA.
Figure 11
Figure 11. CDCs and pDCs from burn-injured mice expressed a lower transcript level of TLR9 and genes related to TLR signaling pathway.
Three days post-injury, cDCs and pDCs were purified by FACS sorting. (a) Transcript level of TLR9 was examined by real-time PCR. Fold changes of TLR expressions of burn and sham mice were normalized to those of untreated control mice. The data analyzed represents the mean ± SEM of 5–6 independent experiments using 10 mice per group. *, p<0.05, sham versus burn by ANOVA. (b) The expressions of genes related to TLR-mediated signal transduction were examined by real-time PCR Array. Fold changes of transcript levels of genes in cDCs and pDCs of burn mice were normalized to the corresponding genes of sham mice per experiment. Genes expression in cDC and pDC of sham mice were set as 1. The data analyzed represent the mean ± SEM (n = 10, 2 independent experiments).

Similar articles

Cited by

References

    1. Hoover L, Bochicchio GV, Napolitano LM, Joshi M, Bochicchio K, et al.. (2006) Systemic inflammatory response syndrome and nosocomial infection in trauma. J Trauma 61: 310–316; discussion 316–317. - PubMed
    1. Sauaia A, Moore FA, Moore EE, Lezotte DC (1996) Early risk factors for postinjury multiple organ failure. World J Surg 20: 392–400. - PubMed
    1. Loose LD, Megirian R, Turinsky J (1984) Biochemical and functional alterations in macrophages after thermal injury. Infect Immun 44: 554–558. - PMC - PubMed
    1. Rodeberg DA, Meyer JG, Babcock GF (1999) Heat shock response: presence and effects in burn patient neutrophils. J Leukoc Biol 66: 773–780. - PubMed
    1. Calum H, Moser C, Jensen PO, Christophersen L, Maling DS, et al. (2009) Thermal injury induces impaired function in polymorphonuclear neutrophil granulocytes and reduced control of burn wound infection. Clin Exp Immunol 156: 102–110. - PMC - PubMed

Publication types

MeSH terms