

Global seasonality of rotavirus disease
- PMID: 23190782
- PMCID: PMC4103797
- DOI: 10.1097/INF.0b013e31827d3b68
Global seasonality of rotavirus disease
Abstract
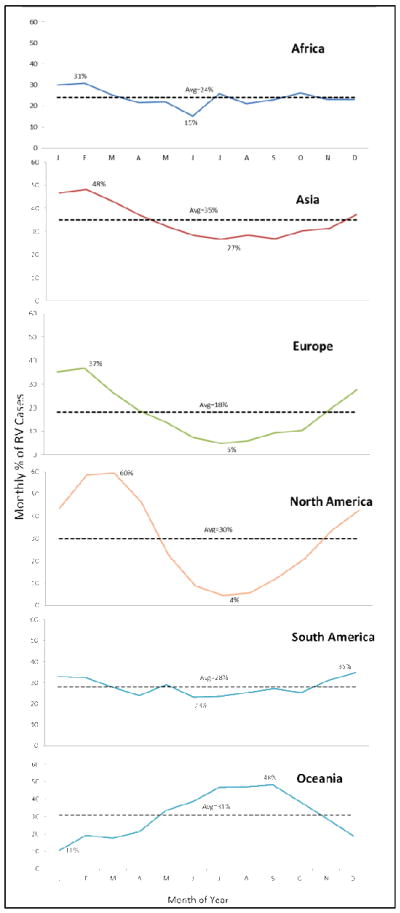
Background: A substantial number of surveillance studies have documented rotavirus prevalence among children admitted for dehydrating diarrhea. We sought to establish global seasonal patterns of rotavirus disease before the introduction of widespread vaccination.
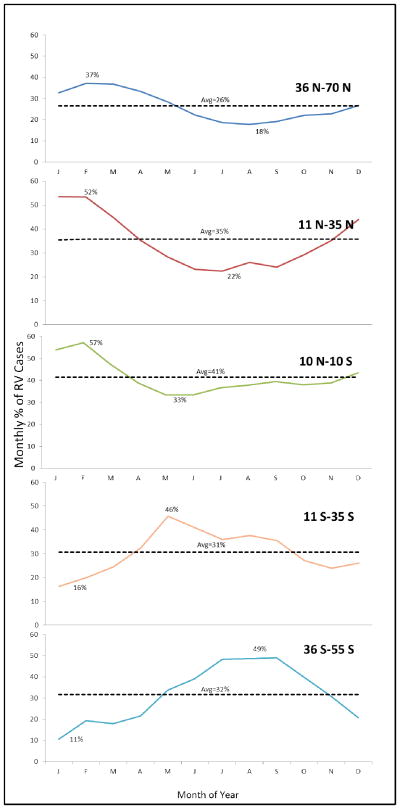
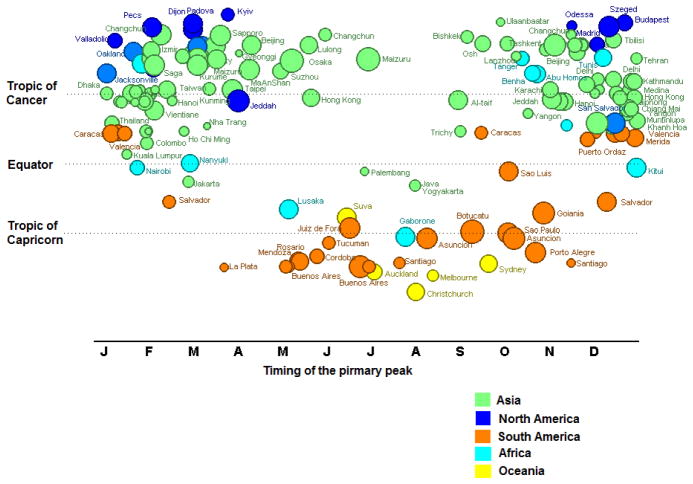
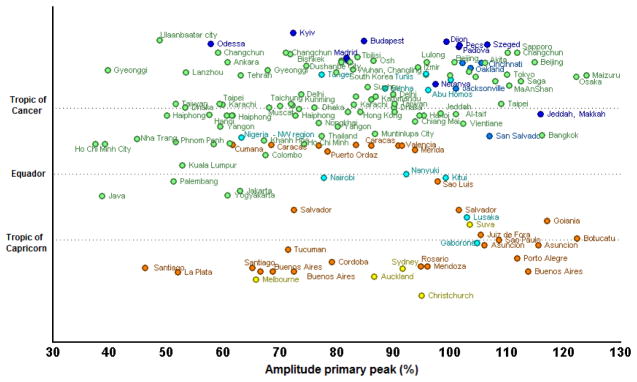
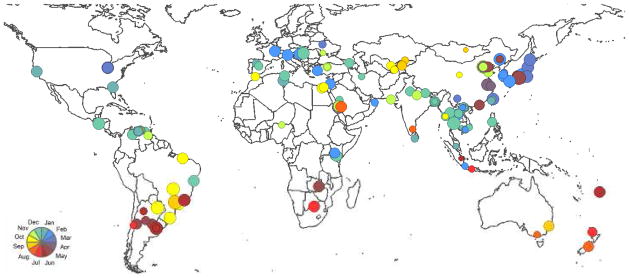
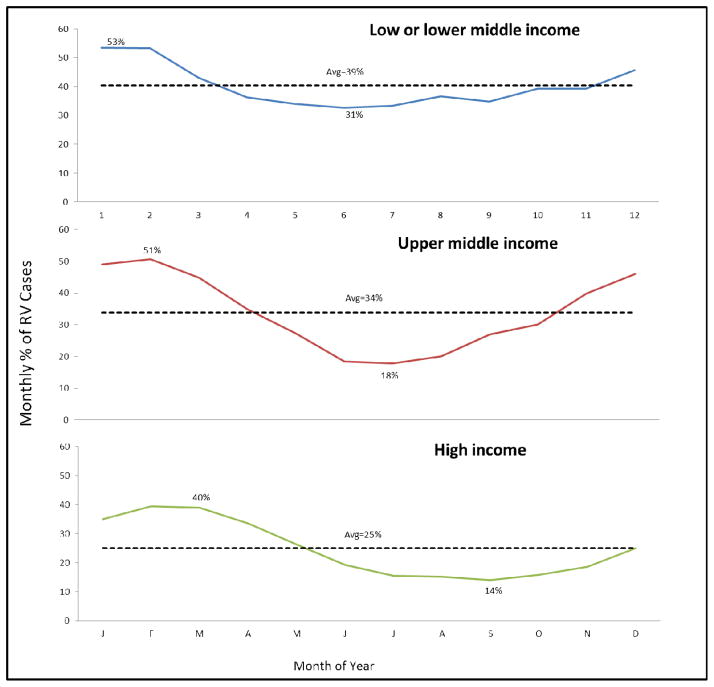
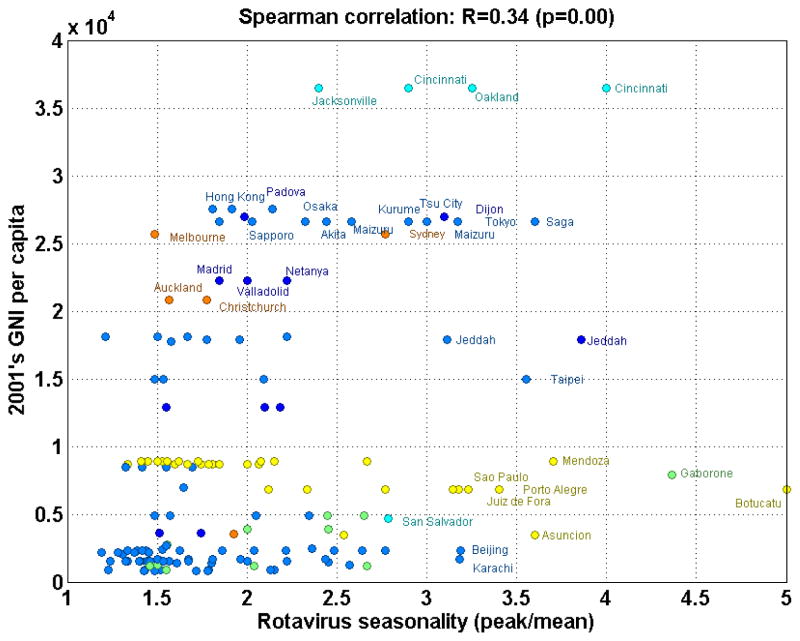
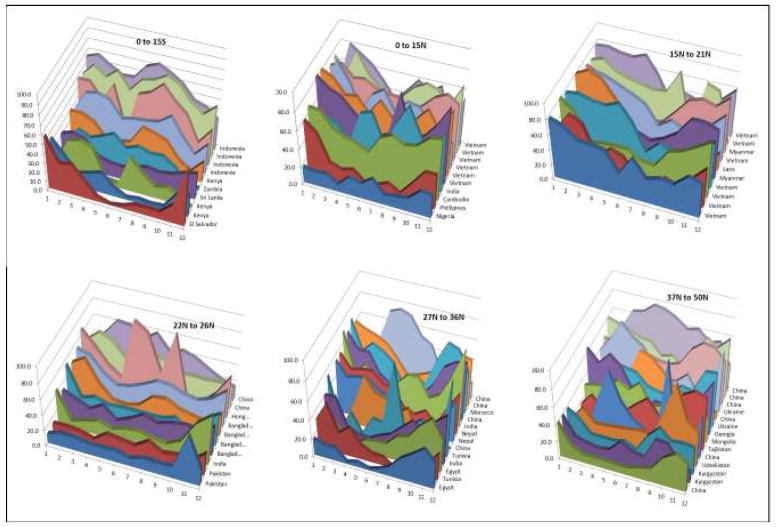
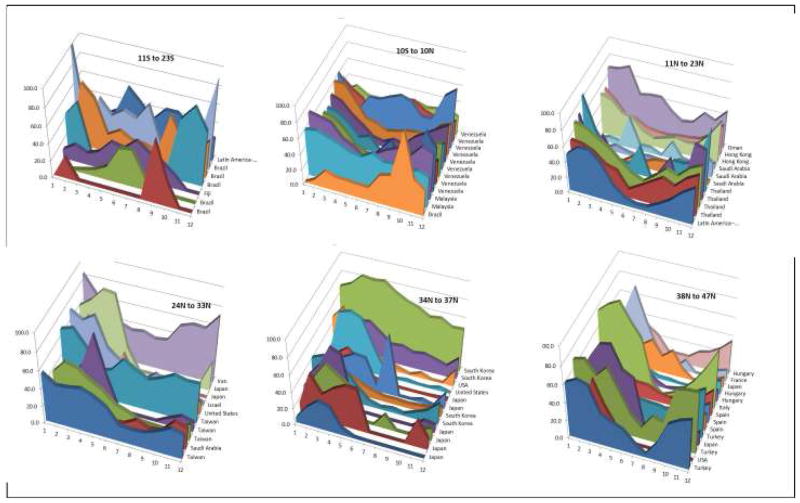
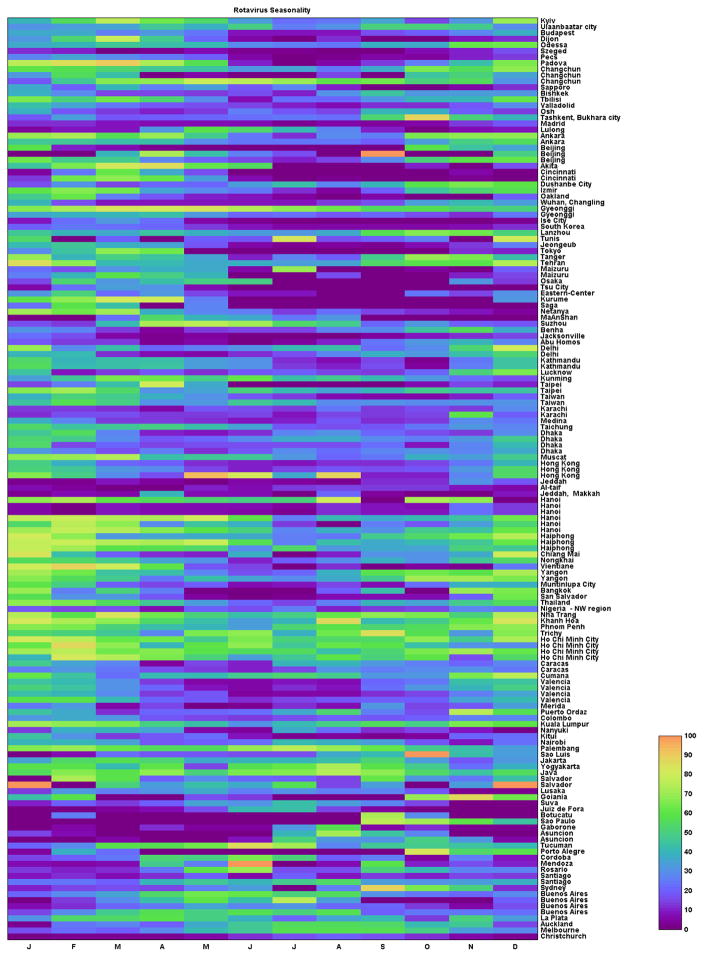
Methods: We reviewed studies of rotavirus detection in children with diarrhea published since 1995. We assessed potential relationships between seasonal prevalence and locality by plotting the average monthly proportion of diarrhea cases positive for rotavirus according to geography, country development and latitude. We used linear regression to identify variables that were potentially associated with the seasonal intensity of rotavirus.
Results: Among a total of 99 studies representing all 6 geographic regions of the world, patterns of year-round disease were more evident in low- and low-middle income countries compared with upper-middle and high-income countries where disease was more likely to be seasonal. The level of country development was a stronger predictor of strength of seasonality (P = 0.001) than geographic location or climate. However, the observation of distinctly different seasonal patterns of rotavirus disease in some countries with similar geographic location, climate and level of development indicate that a single unifying explanation for variation in seasonality of rotavirus disease is unlikely.
Conclusion: While no unifying explanation emerged for varying rotavirus seasonality globally, the country income level was somewhat more predictive of the likelihood of having seasonal disease than other factors. Future evaluation of the effect of rotavirus vaccination on seasonal patterns of disease in different settings may help understand factors that drive the global seasonality of rotavirus disease.
Conflict of interest statement
No conflicts of interest are declared by any of the authors.
None of the authors had any conflicts of interest relevant to this manuscript.
Figures
References
-
- Rotavirus surveillance worldwide - 2009. Wkly Epidemiol Rec. 2011;86:174–176. - PubMed
-
- Forster J, Guarino A, Parez N, et al. Hospital-based surveillance to estimate the burden of rotavirus gastroenteritis among European children younger than 5 years of age. Pediatrics. 2009;123:e393–400. - PubMed
-
- Purohit SG, Kelkar SD, Simha V. Time series analysis of patients with rotavirus diarrhoea in Pune, India. J Diarrhoeal Dis Res. 1998;16:74–83. - PubMed
Publication types
MeSH terms
Grants and funding
LinkOut - more resources
Full Text Sources
Other Literature Sources
Medical
