. 2013 Jan 18;288(3):1533-47.
doi: 10.1074/jbc.M112.384156. Epub 2012 Nov 28.

Autoproteolytic Activation of a Symbiosis-regulated Truffle Phospholipase A2

Affiliations

Autoproteolytic Activation of a Symbiosis-regulated Truffle Phospholipase A2

Davide Cavazzini et al. J Biol Chem. .

Abstract

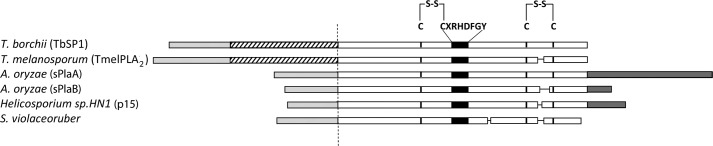
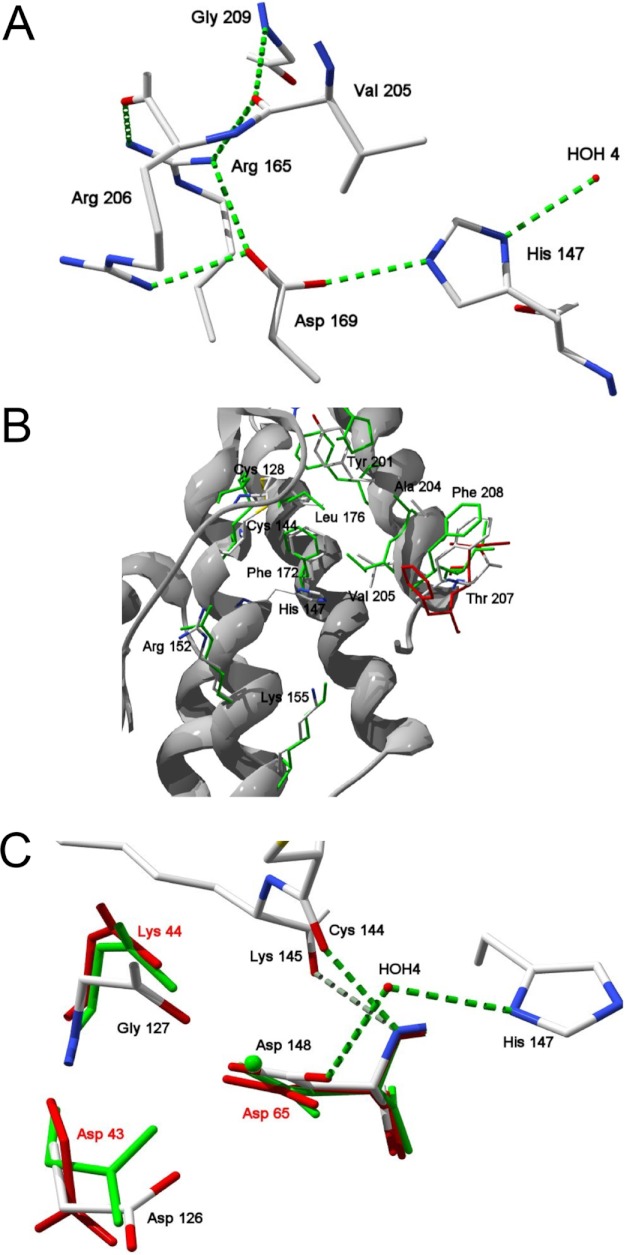
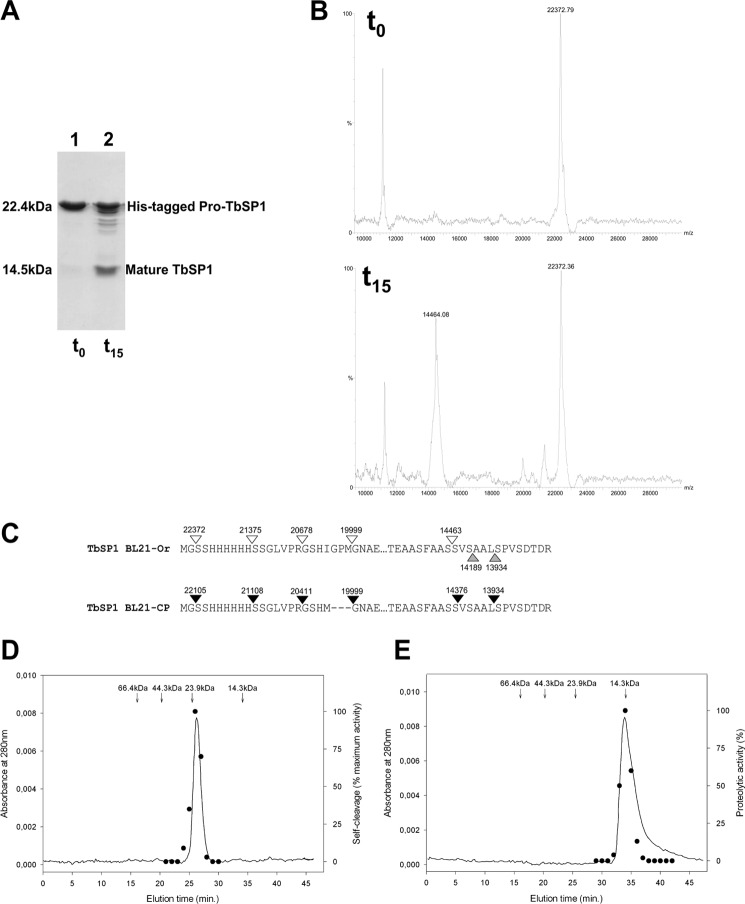
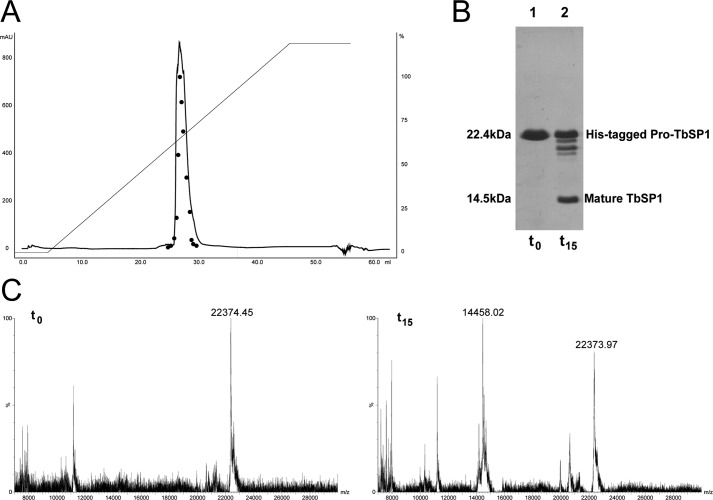
Fungal phospholipases are members of the fungal/bacterial group XIV secreted phospholipases A(2) (sPLA(2)s). TbSP1, the sPLA(2) primarily addressed in this study, is up-regulated by nutrient deprivation and is preferentially expressed in the symbiotic stage of the ectomycorrhizal fungus Tuber borchii. A peculiar feature of this phospholipase and of its ortholog from the black truffle Tuber melanosporum is the presence of a 54-amino acid sequence of unknown functional significance, interposed between the signal peptide and the start of the conserved catalytic core of the enzyme. X-ray diffraction analysis of a recombinant TbSP1 form corresponding to the secreted protein previously identified in T. borchii mycelia revealed a structure comprising the five α-helices that form the phospholipase catalytic module but lacking the N-terminal 54 amino acids. This finding led to a series of functional studies that showed that TbSP1, as well as its T. melanosporum ortholog, is a self-processing pro-phospholipase A(2), whose phospholipase activity increases up to 80-fold following autoproteolytic removal of the N-terminal peptide. Proteolytic cleavage occurs within a serine-rich, intrinsically flexible region of TbSP1, does not involve the phospholipase active site, and proceeds via an intermolecular mechanism. Autoproteolytic activation, which also takes place at the surface of nutrient-starved, sPLA(2) overexpressing hyphae, may strengthen and further control the effects of phospholipase up-regulation in response to nutrient deprivation, also in the context of symbiosis establishment and mycorrhiza formation.


Figures

FIGURE 1.
FIGURE 1.
Schematic representation of functionally characterized group XIV sPLA2s. The start of the catalytic domain region shared by the shown sPLA2s (TbSP1 (16); TmelPLA2, functionally validated in this work (see supplemental Fig. S4); sPlaA and sPlaB (19); p15 (50); and S. violaceoruber PLA2 (51)) is represented on a white background; the active site consensus peptide and positionally conserved, disulfide-bonded Cys residues flanking this site are indicated as black boxes and black vertical lines, respectively. N-terminal polypeptide extensions (interposed between the conserved catalytic domain region and the secretion signal peptide in the T. borchii and T. melanosporum sPLA2s) and C-terminal polypeptide extensions (Aspergillus oryzae and Helicosporium sPLA2s) are shown as striped and dark gray bars, respectively. Experimentally determined (TbSP1, p15, and S. violaceoruber sPLA2s) and predicted (TmelPLA2, sPlaA, and sPlaB) secretion signal peptides are shown as light gray bars. GenBankTM accession numbers are as follows: AAF80454 (TbSP1), CAZ81513 (TmelPLA2), BAD01581 (sPlaA), BAD01582 (sPlaB), BAB70714 (p15), and AAQ55264 (S. violaceoruber sPLA2).
FIGURE 2.
FIGURE 2.
Overall structure of TbSP1. A, ribbon structure of the TbSP1 sPLA2. The five α-helices of the core catalytic domain are indicated by red labels. Key active site residues Asp126, His147, and Asp148 are rendered in stick representations (CPK-colored); also shown are the N and C termini of the protein. B, electron density map of the active site of TbSP1. Shown is a 2FoFc electron density map of the active site residues contoured at 1.0 σ level.
FIGURE 3.
FIGURE 3.
Details of the TbSP1 structure. A, hydrogen bonding network within the catalytic site. Hydrogen bonds are shown in green, amino acid residues are represented as CPK-colored sticks; also shown is a water molecule (HOH4) that participates in the active site hydrogen bond network. B, substrate binding site. TbSP1 residues involved in substrate binding (CPK-colored sticks) are superimposed onto the corresponding residues of the calcium-bound (green sticks) and the calcium-free (red sticks) forms of the S. violaceoruber sPLA2; numbers refer to TbSP1 residues. C, predicted calcium binding site. Superposition of the indicated calcium-binding residues of the Ca2+-bound (green sticks) and the Ca2+-free forms of the Streptomyces sPLA2 with the corresponding amino acid residues of TbSP1 (CPK-colored sticks); the Ca2+ ion is shown as a green sphere. Hydrogen bonds and a hydrogen-bonded water molecule (HOH4) are shown as dashed green lines and as a red sphere, respectively.
FIGURE 4.
FIGURE 4.
Proteolytic self-processing of TbSP1. A, SDS-PAGE profile of recombinant 22-kDa TbSP1 purified from the BL21-Ori strain (lane 1, t0 control) and of the same protein incubated at 37 °C for 15 h at a concentration of 20 μm (lane 2, t15). B, MALDI-TOF analysis of the t0 (upper spectrum) and the t15 (lower spectrum) protein samples utilized for the experiment in A (see “Experimental Procedures” for details). C, map of the cleavage sites identified by MALDI-TOF analysis of the digestion products generated upon incubation of TbSP1 from the BL21-Ori (empty arrowheads) or the BL21-CP (filled arrowheads) strain; upward pointing gray arrowheads indicate the N-terminal amino acid residues revealed by x-ray analysis of TbSP1 crystals. D, recombinant 22-kDa TbSP1, prepurified by metal affinity chromatography, was run on a Superdex 75 5/150 GL column at 4 °C (solid line), and the autoproteolytic activity of individual fractions was assayed by SDS-PAGE analysis as in A (dots); the data shown are from one of three replicates that produced nearly identical results. The elution times and molecular weights of protein standards run on the same column are reported above the chromatogram. E, same as D with the mature (14.5-kDa) form of TbSP1. Individual peak fractions were assayed for proteolytic activity (black dots, right axis) using proteolytically inactive TbSP1 from inclusion bodies as substrate (see “Experimental Procedures” for details).
FIGURE 5.
FIGURE 5.
Autoproteolytic capacity of HPLC-purified TbSP1. A, HPLC chromatogram of His-tagged pro-TbSP1, prepurified by metal affinity and anion exchange chromatography, run on a reverse-phase μRPC C2/C18 ST 4.6/100 column and eluted with a 0–80% acetonitrile gradient (straight line, left axis) in 0.05% trifluoroacetic acid. Peak fractions were collected, transferred to an aqueous buffer, and analyzed for phospholipase activity (filled circles, right axis) as well as self-proteolysis at time 0 (t0 control) and after a 15-h incubation at 37 °C (t15) by both SDS-PAGE (B) and MALDI-TOF (C) (see “Experimental Procedures” for details).
FIGURE 6.
FIGURE 6.
Autoproteolysis-dependent activation of TbSP1. Self-cleavage (empty dots) and PLA2 (filled dots) activities measured in parallel on samples of recombinant 22-kDa TbSP1 (120 μm) incubated for the indicated lengths of time at 37 °C. Maximum PLA2 activity after 16 h (with 10% residual undigested TbSP1) was 415 nmol of product/min/ng of protein. Error bars, S.D.
FIGURE 7.
FIGURE 7.
Autoproteolytic activation of TbSP1 isolated from T. borchii mycelia. A, immunoblot analysis of aqueous extracts (5 μg of total protein each) derived from T. borchii mycelia grown for 14 days on complete synthetic medium and then shifted for 7 days to either the same medium (nutrient-sufficient, mock-shifted control; lane 2, +), or to the same medium lacking nitrogen (lane 3, −N) or carbon (lane 4, −C). A partially digested sample of untagged rTbSP1 was run as a size marker in lane 1. B, MALDI-TOF spectra of TbSP1 (20 μm) purified to near homogeneity from T. borchii mycelia (upper spectrum, t0) and of the same protein incubated for 15 h at 37 °C (lower spectrum, t15); a map of the cleavage sites identified by MALDI-TOF analysis (t15) of the t15 product is shown at the bottom. C, PLA2 specific activity of undigested TbSP1 (white bar) and of the corresponding 14.5-kDa fragment (gray bar) generated upon complete autoproteolysis in vitro. Error bars, S.D.
FIGURE 8.
FIGURE 8.
TbSP1 autodigestion occurs via an intermolecular, endoproteolytic mechanism. A, concentration-dependent increase of the apparent rate constant of the self-cleavage reaction, measured at the indicated concentrations of recombinant pro-TbSP1 (BL21-Ori strain). Individual values were derived from separate time course analyses carried out at different protein concentrations, one of which (30 μm pro-TbSP1) is shown in the inset. B, MALDI-TOF spectrum of the reaction products resulting from incubation (30 min at 37 °C) of a chimeric protein containing pro-TbSP1 fused to the C-terminal end of E. coli thioredoxin (Trx-TbSP1); peaks corresponding to the input Trx-TbSP1 protein and to the 14.5-kDa fragment generated upon autoproteolysis are indicated.
FIGURE 9.
FIGURE 9.
Temperature and pH dependence of the autoproteolytic and phospholipase activities of TbSP1. A, autoproteolytic activity (filled circles) of pro-TbSP1 (BL21-Ori, 20 μm), measured by SDS-PAGE after incubation for 15 h at the indicated temperatures in the presence of the PC substrate (5 mm), without calcium. Also shown is the phospholipase activity of pro-TbSP1 (filled squares) and mature TbSP1 (empty squares) (BL21-Ori, 0.05 μm), measured after a 10-min incubation at the indicated temperatures in the presence of 5 mm PC and 30 mm CaCl2. B, pH dependence of TbSP1 autoproteolytic (22-kDa form; filled circles) and phospholipase (14.5-kDa form; empty squares) activities (see “Experimental Procedures” for details). Error bars, S.D.
FIGURE 10.
FIGURE 10.
Differential calcium requirements of the phospholipase and autoproteolytic activities of TbSP1. A, PC hydrolysis supported by pro-TbSP1 (0.5 μm; filled circles, solid line), by mature TbSP1 (0.0125 μm; empty circles, dashed line), and by the D126N mutant form of mature (14.5-kDa) TbSP1 (1 μm; triangles, dashed-dotted line) in the presence of increasing CaCl2 concentrations; different concentrations of the various TbSP1 proteins were used in order to support comparable initial rates of substrate conversion. Data were fitted to a hyperbolic equation by the nonlinear least square method. B, autoproteolytic activity measured by incubating Ca2+-unsupplemented pro-TbSP1 (40 μm; gray bar), the same protein supplemented with 10 mm CaCl2 (white bar), or pro-TbSP1 treated with 5 mm EDTA, followed by EDTA removal (black bar) for 15 h at 37 °C; reaction mixtures were analyzed by SDS-PAGE and MALDI-TOF MS as specified under “Experimental Procedures.” Error bars, S.D.

References

    1. Murakami M., Taketomi Y., Miki Y., Sato H., Hirabayashi T., Yamamoto K. (2011) Recent progress in phospholipase A research. From cells to animals to humans. Prog. Lipid Res. 50, 152–192 - PubMed
    1. Dennis E. A., Cao J., Hsu Y. H., Magrioti V., Kokotos G. (2011) Phospholipase A2 enzymes. Physical structure, biological function, disease implication, chemical inhibition, and therapeutic intervention. Chem. Rev. 111, 6130–6185 - PMC - PubMed
    1. Köhler G. A., Brenot A., Haas-Stapleton E., Agabian N., Deva R., Nigam S. (2006) Phospholipase A2 and phospholipase B activities in fungi. Biochim. Biophys. Acta 1761, 1391–1399 - PMC - PubMed
    1. Drissner D., Kunze G., Callewaert N., Gehrig P., Tamasloukht M., Boller T., Felix G., Amrhein N., Bucher M. (2007) Lysophosphatidylcholine is a signal in the arbuscular mycorrhizal symbiosis. Science 318, 265–268 - PubMed
    1. Lee H. Y., Bahn S. C., Shin J. S., Hwang I., Back K., Doelling J. H., Ryu S. B. (2005) Multiple forms of secretory phospholipase A2 in plants. Prog. Lipid Res. 44, 52–67 - PubMed

Publication types

MeSH terms

Associated data

LinkOut - more resources