. 2013 Jun;267(3):747-56.
doi: 10.1148/radiol.12112789. Epub 2012 Nov 28.

Pulmonary perfused blood volume with dual-energy CT as surrogate for pulmonary perfusion assessed with dynamic multidetector CT

Affiliations

Pulmonary perfused blood volume with dual-energy CT as surrogate for pulmonary perfusion assessed with dynamic multidetector CT

Matthew K Fuld et al. Radiology. 2013 Jun.

Abstract

Purpose: To compare measurements of regional pulmonary perfused blood volume (PBV) and pulmonary blood flow (PBF) obtained with computed tomography (CT) in two pig models.

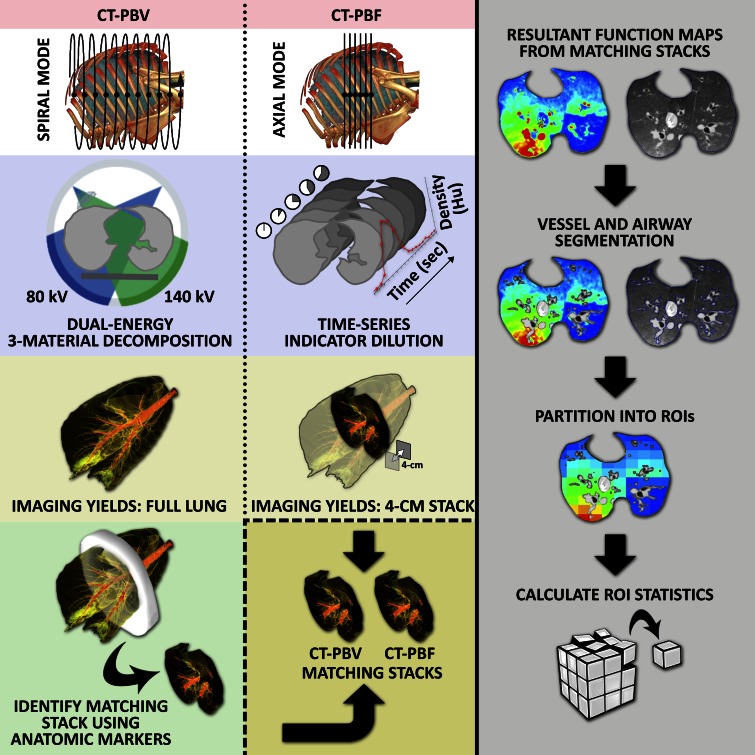
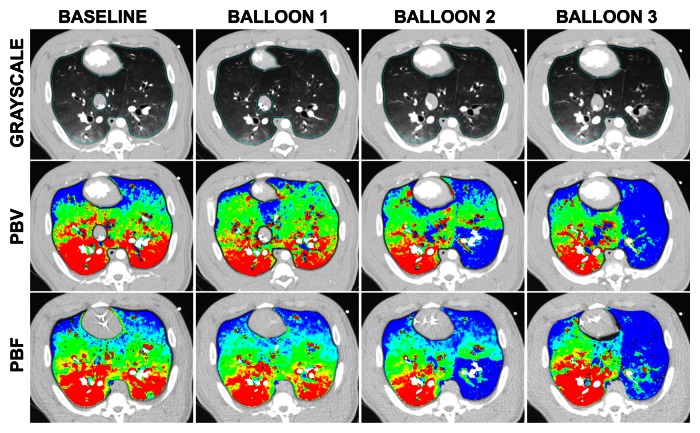
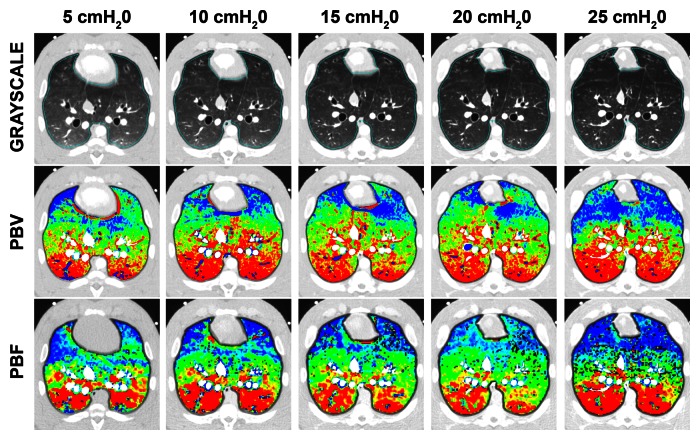
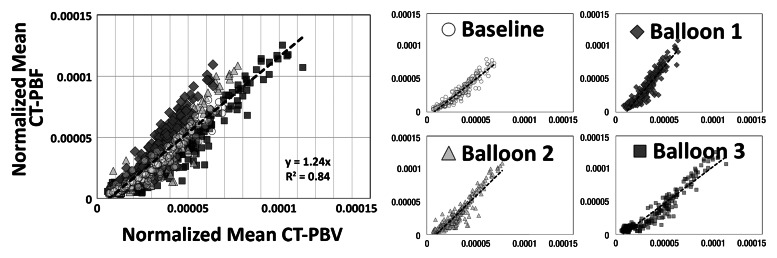
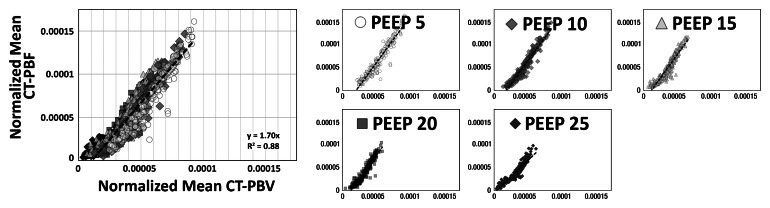
Materials and methods: The institutional animal care and use committee approved all animal studies. CT-derived PBF and PBV were determined in four anesthetized, mechanically ventilated, supine swine by using two methods for creating pulmonary parenchymal perfusion heterogeneity. Two animals were examined after sequentially moving a pulmonary arterial balloon catheter from a distal to a central location, and two others were examined over a range of static airway pressures, which varied the extents of regional PBF. Lung sections were divided into blocks and Pearson correlation coefficients calculated to compare matching regions between the two methods.

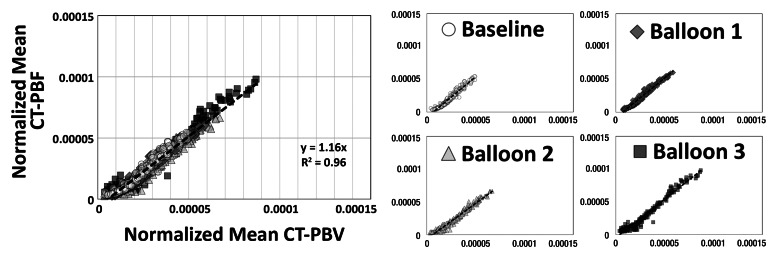
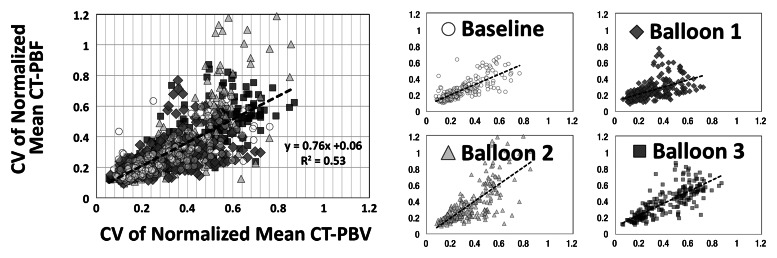
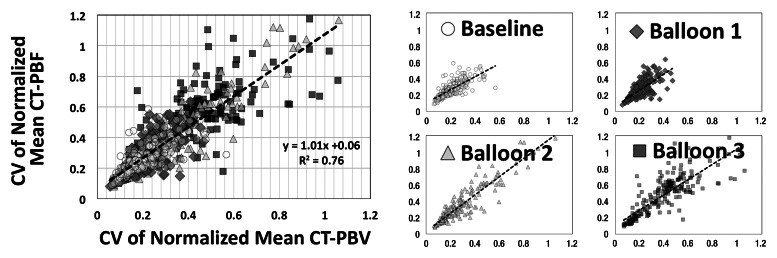
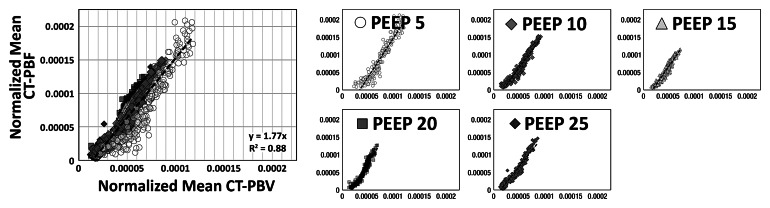
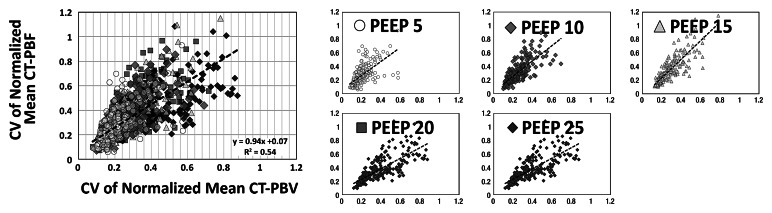
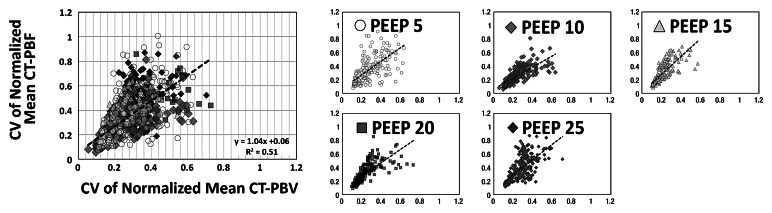
Results: CT-derived PBF, CT-derived PBV, and their associated coefficients of variation (CV) were closely correlated on a region-by-region basis in both the balloon occlusion (Pearson R = 0.91 and 0.73 for animals 1 and 2, respectively; Pearson R = 0.98 and 0.87 for comparison of normalized mean and CV for animals 1 and 2, respectively) and lung inflation studies (Pearson R = 0.94 and 0.74 for animals 3 and 4, respectively; Pearson R = 0.94 and 0.69 for normalized mean and CV for animals 3 and 4, respectively). When accounting for region-based effects, correlations remained highly significant at the P < .001 level.

Conclusion: CT-derived PBV heterogeneity is a suitable surrogate for CT-derived PBF heterogeneity.


Figures

Figure 1:
Figure 1:
Flowchart of image acquisition and analysis process. The CT-derived PBV method (left column) employs dual-energy imaging in spiral scanning mode with a three-material decomposition process to extract iodine attenuation for full lung. The CT-derived PBF method (middle column) employs an axial scanning mode to perform time-series indicator dilution, resulting in a blood flow map for a 4-cm section stack of the lung near the heart. To compare CT-derived PBF and PBV, a matching 4-cm section stack is identified and extracted from the full-lung CT-derived PBV scan. Semiautomated lung segmentation along with vessel and airway segmentation is used to limit the analysis region to lung parenchyma (right column, second row). The 4-cm section stacks are then divided into a 10 × 10 × 3 grid of blocks and the mean and CV within each block calculated.
Figure 2a:
Figure 2a:
Gray-scale, PBV, and PBF CT scans. (a) Color map comparison of CT-derived PBF and PBV from pig studied with balloon occlusion model. (b) Color map comparison of CT-derived PBF and PBV from pig studied at five different lung volumes, which were used to achieve a range of pulmonary perfusion values. Color coding is the same for each condition, with low values in blue and high values in red.
Figure 2b:
Figure 2b:
Gray-scale, PBV, and PBF CT scans. (a) Color map comparison of CT-derived PBF and PBV from pig studied with balloon occlusion model. (b) Color map comparison of CT-derived PBF and PBV from pig studied at five different lung volumes, which were used to achieve a range of pulmonary perfusion values. Color coding is the same for each condition, with low values in blue and high values in red.
Figure 3a:
Figure 3a:
Comparison of normalized mean values and CVs of CT-derived PBF versus CT-derived PBV in two animals studied with balloon occlusion model, which was used to achieve a range of pulmonary perfusion values and heterogeneities. Values are percentages of summed total voxel values. (a, b) Normalized mean values for animals 1 and 2, respectively. (c, d) CVs of normalized values for animals 1 and 2, respectively.
Figure 3b:
Figure 3b:
Comparison of normalized mean values and CVs of CT-derived PBF versus CT-derived PBV in two animals studied with balloon occlusion model, which was used to achieve a range of pulmonary perfusion values and heterogeneities. Values are percentages of summed total voxel values. (a, b) Normalized mean values for animals 1 and 2, respectively. (c, d) CVs of normalized values for animals 1 and 2, respectively.
Figure 3c:
Figure 3c:
Comparison of normalized mean values and CVs of CT-derived PBF versus CT-derived PBV in two animals studied with balloon occlusion model, which was used to achieve a range of pulmonary perfusion values and heterogeneities. Values are percentages of summed total voxel values. (a, b) Normalized mean values for animals 1 and 2, respectively. (c, d) CVs of normalized values for animals 1 and 2, respectively.
Figure 3d:
Figure 3d:
Comparison of normalized mean values and CVs of CT-derived PBF versus CT-derived PBV in two animals studied with balloon occlusion model, which was used to achieve a range of pulmonary perfusion values and heterogeneities. Values are percentages of summed total voxel values. (a, b) Normalized mean values for animals 1 and 2, respectively. (c, d) CVs of normalized values for animals 1 and 2, respectively.
Figure 4a:
Figure 4a:
Comparison of normalized mean values and CVs of CT-derived PBF versus CT-derived PBV in two animals studied with the lung inflation model, which was used to achieve a range of pulmonary perfusion values and heterogeneities. Values are percentages of summed total voxel values. (a, b) Normalized mean values for animals 3 and 4, respectively. (c, d) CVs of normalized values for animals 3 and 4, respectively.
Figure 4b:
Figure 4b:
Comparison of normalized mean values and CVs of CT-derived PBF versus CT-derived PBV in two animals studied with the lung inflation model, which was used to achieve a range of pulmonary perfusion values and heterogeneities. Values are percentages of summed total voxel values. (a, b) Normalized mean values for animals 3 and 4, respectively. (c, d) CVs of normalized values for animals 3 and 4, respectively.
Figure 4c:
Figure 4c:
Comparison of normalized mean values and CVs of CT-derived PBF versus CT-derived PBV in two animals studied with the lung inflation model, which was used to achieve a range of pulmonary perfusion values and heterogeneities. Values are percentages of summed total voxel values. (a, b) Normalized mean values for animals 3 and 4, respectively. (c, d) CVs of normalized values for animals 3 and 4, respectively.
Figure 4d:
Figure 4d:
Comparison of normalized mean values and CVs of CT-derived PBF versus CT-derived PBV in two animals studied with the lung inflation model, which was used to achieve a range of pulmonary perfusion values and heterogeneities. Values are percentages of summed total voxel values. (a, b) Normalized mean values for animals 3 and 4, respectively. (c, d) CVs of normalized values for animals 3 and 4, respectively.

References

    1. Alford SK, van Beek EJ, McLennan G, Hoffman EA. Heterogeneity of pulmonary perfusion as a mechanistic image-based phenotype in emphysema susceptible smokers. Proc Natl Acad Sci U S A 2010;107(16):7485–7490 - PMC - PubMed
    1. Hoffman EA, Simon BA, McLennan G. State of the art: a structural and functional assessment of the lung via multidetector-row computed tomography—phenotyping chronic obstructive pulmonary disease. Proc Am Thorac Soc 2006;3(6):519–532 - PMC - PubMed
    1. Easley RB, Fuld MK, Fernandez-Bustamante A, Hoffman EA, Simon BA. Mechanism of hypoxemia in acute lung injury evaluated by multidetector-row CT. Acad Radiol 2006;13(7):916–921 - PubMed
    1. Thieme SF, Hoegl S, Nikolaou K, et al. Pulmonary ventilation and perfusion imaging with dual-energy CT. Eur Radiol 2010;20(12):2882–2889 - PubMed
    1. Thieme SF, Johnson TR, Reiser MF, Nikolaou K. Dual-energy lung perfusion computed tomography: a novel pulmonary functional imaging method. Semin Ultrasound CT MR 2010;31(4):301–308 - PubMed

Publication types