. 2013 Mar;31(3):447-57.
doi: 10.1002/stem.1289.

Insulin inhibits cardiac mesoderm, not mesendoderm, formation during cardiac differentiation of human pluripotent stem cells and modulation of canonical Wnt signaling can rescue this inhibition

Affiliations

Insulin inhibits cardiac mesoderm, not mesendoderm, formation during cardiac differentiation of human pluripotent stem cells and modulation of canonical Wnt signaling can rescue this inhibition

Xiaojun Lian et al. Stem Cells. 2013 Mar.

Abstract

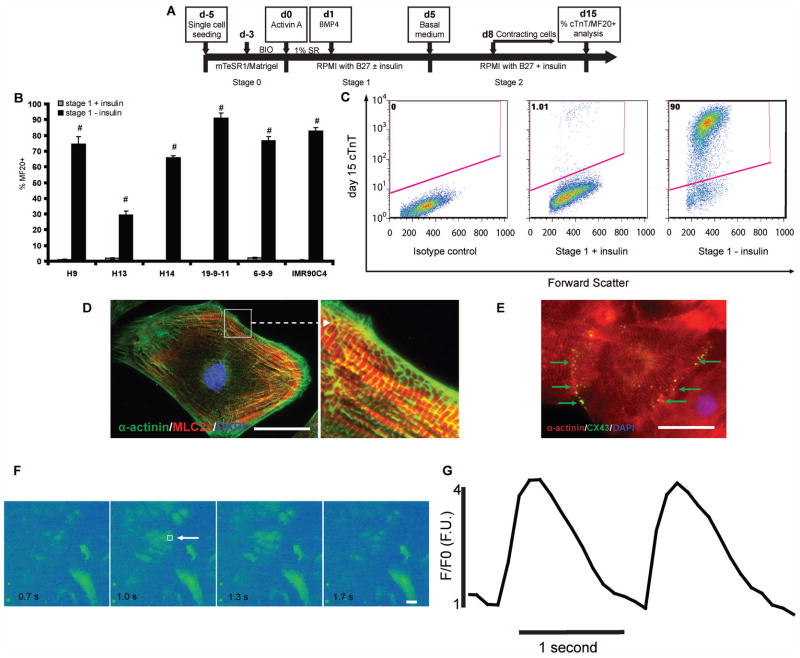
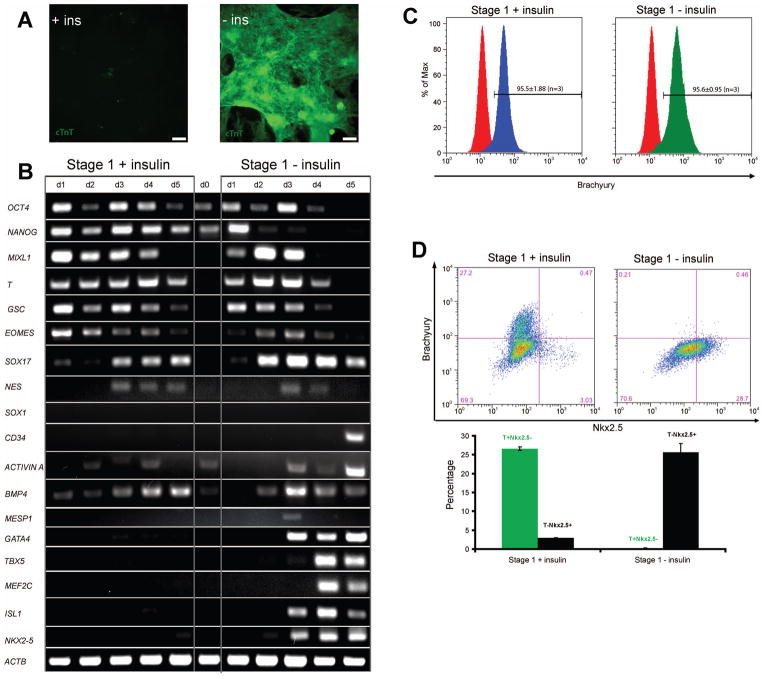
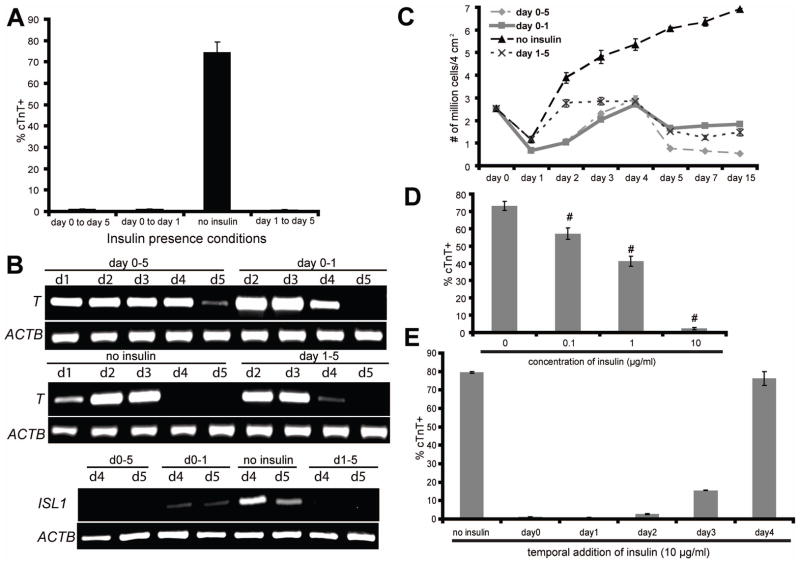
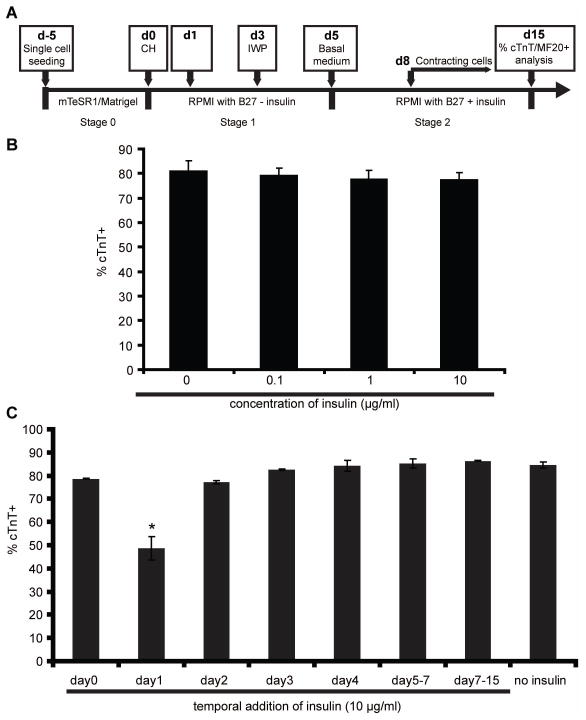
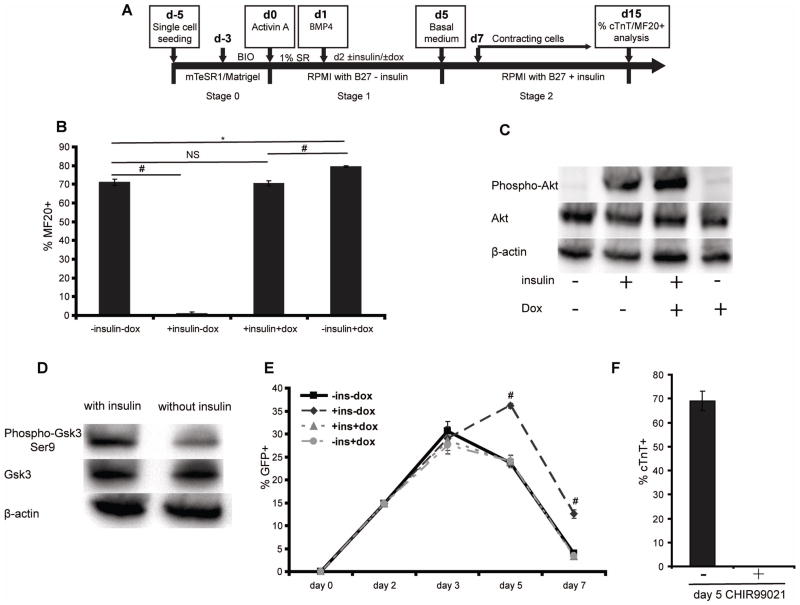
The study of the regulatory signaling hierarchies of human heart development is limited by a lack of model systems that can reproduce the precise developmental events that occur during human embryogenesis. The advent of human pluripotent stem cell (hPSC) technology and robust cardiac differentiation methods affords a unique opportunity to monitor the full course of cardiac induction in vitro. Here, we show that stage-specific activation of insulin signaling strongly inhibited cardiac differentiation during a monolayer-based differentiation protocol that used transforming growth factor β superfamily ligands to generate cardiomyocytes. However, insulin did not repress cardiomyocyte differentiation in a defined protocol that used small molecule regulators of canonical Wnt signaling. By examining the context of insulin inhibition of cardiomyocyte differentiation, we determined that the inhibitory effects by insulin required Wnt/β-catenin signaling and that the cardiomyocyte differentiation defect resulting from insulin exposure was rescued by inhibition of Wnt/β-catenin during the cardiac mesoderm (Nkx2.5+) stage. Thus, insulin and Wnt/β-catenin signaling pathways, as a network, coordinate to influence hPSC differentiation to cardiomyocytes, with the Wnt/β-catenin pathway dominant to the insulin pathway. Our study contributes to the understanding of the regulatory hierarchies of human cardiomyocyte differentiation and has implications for modeling human heart development.


Conflict of interest statement

DISCLOSURE OF POTENTIAL CONFLICTS OF INTEREST

T.J.K. is a founder and consultant for Cellular Dynamics International, a company that uses human stem cells for drug testing. All the other authors declare no competing financial interests.

Figures

Figure 1
Figure 1
(A) Schematic of protocol for hPSC differentiation to cardiomyocytes via Gsk3 inhibition, Activin A, and BMP4. The differentiation process is divided into three stages, d-5 to d0 (stage 0); d0 to d5 (stage 1); d5 and after (stage 2). (B–C) H9, H13, and H14 hESC lines and 19-9-11, 6-9-9, and IMR90C4 iPSC lines were cultured on Matrigel in mTeSR1 and then differentiated into cardiomyocytes according to (A). 15 days after initiation of differentiation, cells were analyzed by flow cytometry using the MF20 antibody. Error bars represent the s.e.m. of three independent experiments. # p<0.005, each pair of time points with insulin versus without insulin; t test. (C) 15 days after initiation of differentiation of 19-9-11 cells using the protocol shown in (A), cells differentiated in the presence and absence of insulin during stage 1 were analyzed for cTnT expression by flow cytometry. (D–G) Cardiomyocytes were generated from H9 cells using the protocol described in (A) without insulin during stage 1. At day 30, cells were individualized and replated on 0.1% gelatin coated coverslips. Immunostaining for (D) α-actinin (green) and MLC2a (red) shows sarcomere organization and (E) connexin 43 (green) and α-actinin (red) immunostaining shows gap junction formation between neighboring cardiomyocytes. Scale bar = 50 μm. (F–G) Cells were treated with 10 μM Fluo-4 AM for 15 min and then Ca2+ transients were recorded with a temporal resolution at 10 frames per second. Box (white arrowhead) in panel (F) denotes the site of analysis of absolute fluorescence normalized to initial fluorescence (F/F0) shown in panel G. Scale bar = 50 μm.
Figure 2
Figure 2
(A) H9 cells were differentiated as described in Fig. 1(A). At day 15 hPSCs differentiated in the presence and absence of insulin during stage 1 (days 0–5) were analyzed for cTnT expression by immunofluorescence. Scale bar = 200 μm. (B) At different time points, mRNA was collected and RT-PCR analysis of pluripotent (OCT4, NANOG), mesendoderm (MIXL1, T, GSC, EOMES), ectodermal (NES, SOX1), endodermal (SOX17), hematopoietic progenitor (CD34), growth factors (ACTIVIN A, BMP4) and cardiac gene expression (MESP1, GATA4, TBX5, MEF2C, ISL1, NKX2-5) was performed. (C–D) After initiation of differentiation, cells were analyzed for (C) brachyury expression at day 1 and (D) brachyury and Nkx2.5 expression at day 5 by flow cytometry. Error bars represent the s.e.m. of three independent experiments.
Figure 3
Figure 3
(A–D) H9 cells were differentiated as described in Fig. 1(A), with insulin present or absent during the indicated stages of differentiation. (A) 15 days after initiation of differentiation, cells were analyzed for cTnT expression by flow cytometry. (B) At different time points, mRNA was collected and RT-PCR analysis of mesendoderm (T) and cardiac gene expression (ISL1) was performed. (C) At different time points, single cells were prepared by Accutase treatment and counted. (D–E) Cardiomyocytes were generated from H9 cells using the protocol described in Fig. 1(A), with RPMI/B27-insulin medium used from day 0 to day 5. (D) At day 1, indicated concentrations of insulin were added into the culture medium and flow cytometry for cTnT expression was performed at day 15. Error bars represent the s.e.m. of eight independent experiments. # p<0.005, each sample with insulin versus without insulin; t test. (E) 10 μg/ml insulin was added to the culture medium at the indicated time points of differentiation. 15 days after initiation of differentiation, cells were analyzed for cTnT expression by flow cytometry. Error bars represent the s.e.m. of three independent experiments.
Figure 4
Figure 4
(A) Schematic of GiWi protocol for fully defined, growth factor-free differentiation of hPSCs to cardiomyocytes via treatment with small molecule modulators of Wnt signaling. (B–C) Cardiomyocytes were generated from 19-9-11 cells using the cardiac directed differentiation protocol described in (A), with exposure to 12 μM CHIR99021 at day 0 and 5 μM IWP4 at day 3. (B) At day 0, the indicated concentration of insulin was added into the culture medium. 15 days after differentiation, cTnT expression was determined by flow cytometry. Error bars represent the s.e.m. of three independent experiments. No statistically significant difference between samples were identified using one-way ANOVA and Tukey post tests (p>0.05). (C) 10 μg/ml insulin was added to the culture medium at different time points of differentiation. 15 days after initiation of differentiation, cells were analyzed for cTnT expression by flow cytometry. Error bars represent the s.e.m. of three independent experiments. * p<0.05, data were compared using one-way ANOVA and Tukey post tests, with the asterisk indicating day 1 is significantly different from other samples.
Figure 5
Figure 5
(A) Schematic of the GiAB differentiation protocol with insulin and doxycycline modulation. (B) H9 ishcat-1 cells were differentiated as described in (A). 10 μg/ml insulin and 2 μg/ml dox were added or not, as indicated, into the culture medium at day 2. 15 days after initiation of differentiation, cells were analyzed using the MF20 antibody by flow cytometry. Error bars represent the s.e.m. of three independent experiments. # p<0.005, * p<0.05, NS p>0.05, each group comparison indicated by the line; t test. (C) H9 ishcat-1 cells were differentiated as shown in (A) and western blot analysis of Akt phosphorylation was performed on day 3. (D) H9 cells were differentiated as shown in Figure 1(A) with or without insulin and western blot analysis of Gsk3β phosphorylation was performed on day 3. (E) H9-7TGP-ishcat-1 cells were differentiated as described in (A). At different time points, single cells were prepared with Accutase treatment and GFP+ cells were quantified with flow cytometry. # p<0.005, one-way ANOVA of the same day samples. (F) H9-7TGP-ishcat-1 cells were differentiated as described in (A). 3 μM CH was added or not into culture medium at day 5. 15 days after initiation of differentiation, cells were analyzed for cTnT expression by flow cytometry. Error bars represent the s.e.m. of three independent experiments.

References

    1. Keller G. Embryonic stem cell differentiation: emergence of a new era in biology and medicine. Genes Dev. 2005;19:1129–1155. - PubMed
    1. Pera MF, Trounson AO. Human embryonic stem cells: prospects for development. Development. 2004;131:5515–5525. - PubMed
    1. Meyer JS, Shearer RL, Capowski EE, et al. Modeling early retinal development with human embryonic and induced pluripotent stem cells. Proc Natl Acad Sci U S A. 2009;106:16698–16703. - PMC - PubMed
    1. Li P, Cavallero S, Gu Y, et al. IGF signaling directs ventricular cardiomyocyte proliferation during embryonic heart development. Development. 2011;138:1795–1805. - PMC - PubMed
    1. Xin M, Kim Y, Sutherland LB, et al. Regulation of insulin-like growth factor signaling by Yap governs cardiomyocyte proliferation and embryonic heart size. Sci Signal. 2011;4:ra70. - PMC - PubMed

Publication types