

Longitudinal sleep EEG trajectories indicate complex patterns of adolescent brain maturation
- PMID: 23193115
- PMCID: PMC3567357
- DOI: 10.1152/ajpregu.00422.2012
Longitudinal sleep EEG trajectories indicate complex patterns of adolescent brain maturation
Abstract
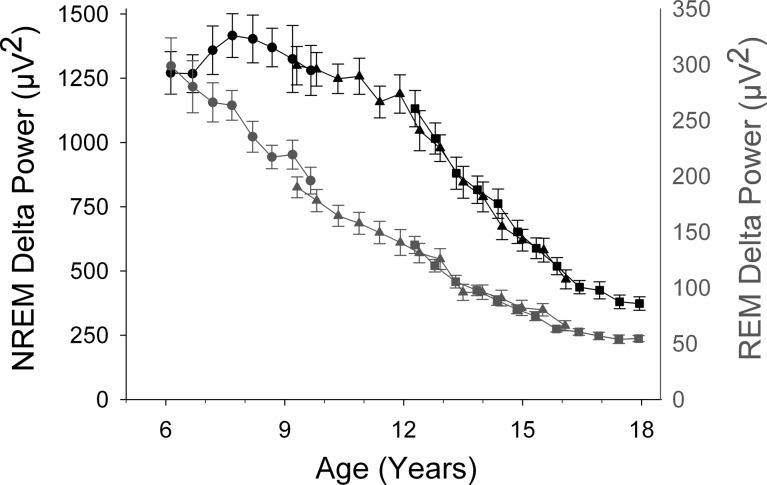
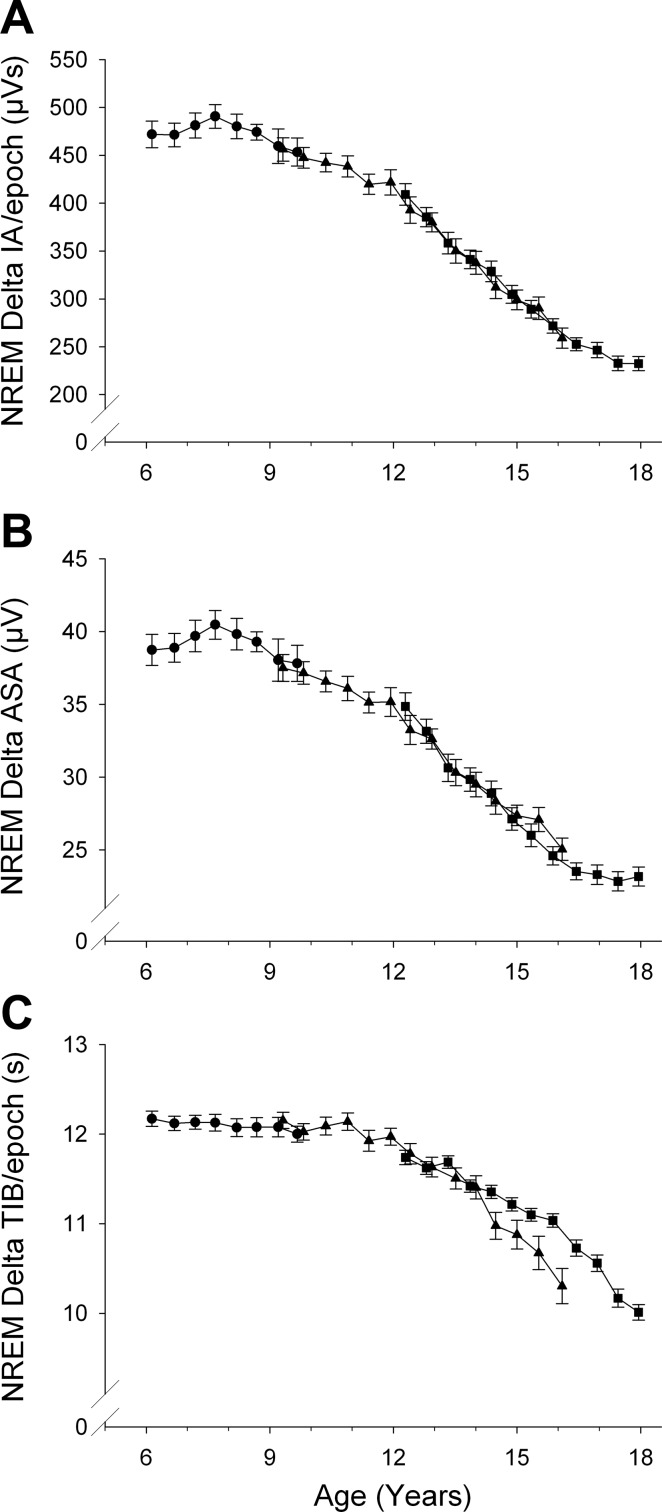
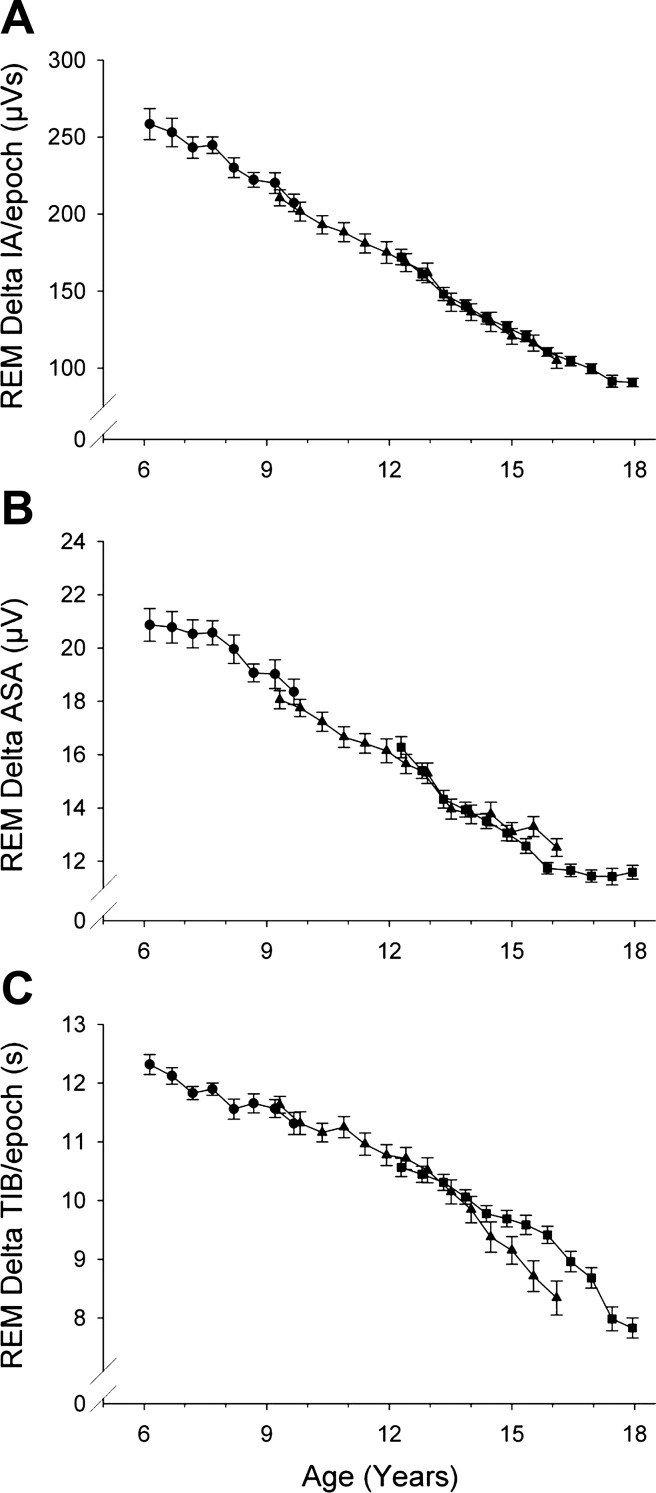
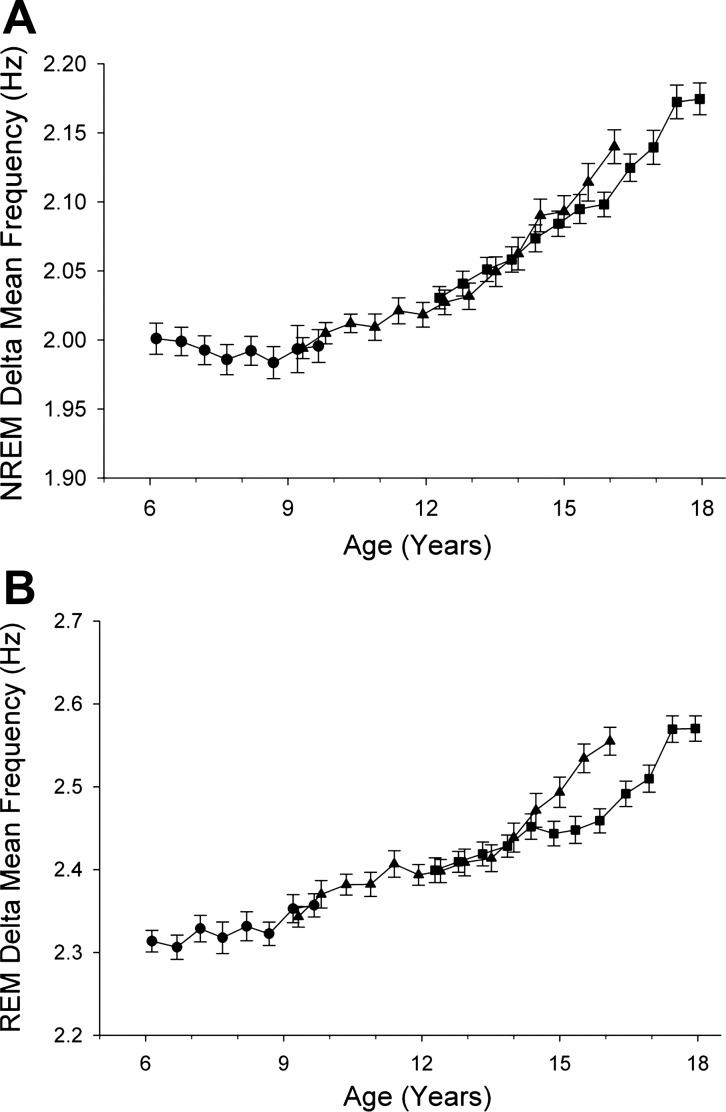
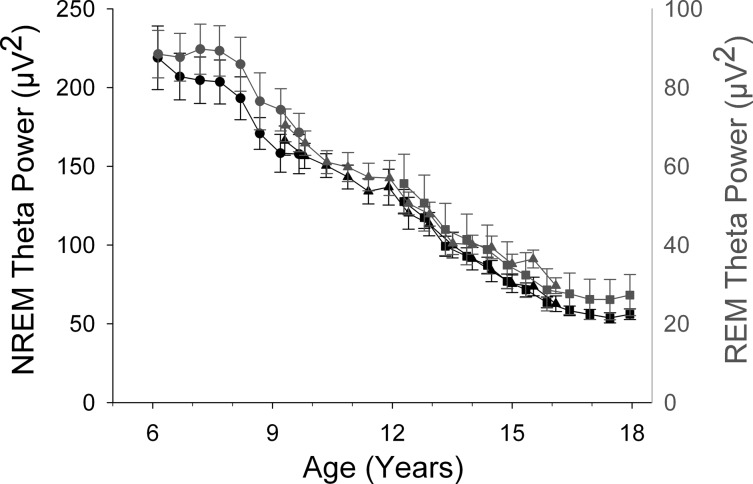
New longitudinal sleep data spanning ages 6-10 yr are presented and combined with previous data to analyze maturational trajectories of delta and theta EEG across ages 6-18 yr in non-rapid eye movement (NREM) and rapid eye movement (REM) sleep. NREM delta power (DP) increased from age 6 to age 8 yr and then declined. Its highest rate of decline occurred between ages 12 and 16.5 yr. We attribute the delta EEG trajectories to changes in synaptic density. Whatever their neuronal underpinnings, these age curves can guide research into the molecular-genetic mechanisms that underlie adolescent brain development. The DP trajectories in NREM and REM sleep differed strikingly. DP in REM did not initially increase but declined steadily from age 6 to age 16 yr. We hypothesize that the DP decline in REM reflects maturation of the same brain arousal systems that eliminate delta waves in waking EEG. Whereas the DP age curves differed in NREM and REM sleep, theta age curves were similar in both, roughly paralleling the age trajectory of REM DP. The different maturational curves for NREM delta and theta indicate that they serve different brain functions despite having similar within-sleep dynamics and responses to sleep loss. Period-amplitude analysis of NREM and REM delta waveforms revealed that the age trends in DP were driven more by changes in wave amplitude rather than incidence. These data further document the powerful and complex link between sleep and brain maturation. Understanding this relationship would shed light on both brain development and the function of sleep.
Figures
Similar articles
-
The maturational trajectories of NREM and REM sleep durations differ across adolescence on both school-night and extended sleep.Am J Physiol Regul Integr Comp Physiol. 2012 Mar 1;302(5):R533-40. doi: 10.1152/ajpregu.00532.2011. Epub 2011 Nov 23. Am J Physiol Regul Integr Comp Physiol. 2012. PMID: 22116514 Free PMC article.
-
Topographic differences in the adolescent maturation of the slow wave EEG during NREM sleep.Sleep. 2011 Mar 1;34(3):325-33. doi: 10.1093/sleep/34.3.325. Sleep. 2011. PMID: 21358849 Free PMC article.
-
Developmental changes in the sleep electroencephalogram of adolescent boys and girls.J Sleep Res. 2012 Feb;21(1):59-67. doi: 10.1111/j.1365-2869.2011.00930.x. Epub 2011 Jun 13. J Sleep Res. 2012. PMID: 21668552 Free PMC article.
-
Sleep EEG changes during adolescence: an index of a fundamental brain reorganization.Brain Cogn. 2010 Feb;72(1):56-65. doi: 10.1016/j.bandc.2009.09.008. Epub 2009 Nov 2. Brain Cogn. 2010. PMID: 19883968 Review.
-
The visual scoring of sleep and arousal in infants and children.J Clin Sleep Med. 2007 Mar 15;3(2):201-40. J Clin Sleep Med. 2007. PMID: 17557427 Review.
Cited by
-
Age-Related Differences in Sleep Architecture and Electroencephalogram in Adolescents in the National Consortium on Alcohol and Neurodevelopment in Adolescence Sample.Sleep. 2016 Jul 1;39(7):1429-39. doi: 10.5665/sleep.5978. Sleep. 2016. PMID: 27253763 Free PMC article.
-
Sleep to Internalizing Pathway in Young Adolescents (SIPYA): A proposed neurodevelopmental model.Neurosci Biobehav Rev. 2022 Sep;140:104780. doi: 10.1016/j.neubiorev.2022.104780. Epub 2022 Jul 14. Neurosci Biobehav Rev. 2022. PMID: 35843345 Free PMC article. Review.
-
The effects of age, gender, hopelessness, and exposure to violence on sleep disorder symptoms and daytime sleepiness among adolescents in impoverished neighborhoods.J Youth Adolesc. 2015 Feb;44(2):518-42. doi: 10.1007/s10964-014-0160-5. Epub 2014 Jul 29. J Youth Adolesc. 2015. PMID: 25070645
-
Maturational Patterns of Sigma Frequency Power Across Childhood and Adolescence: A Longitudinal Study.Sleep. 2016 Jan 1;39(1):193-201. doi: 10.5665/sleep.5346. Sleep. 2016. PMID: 26285004 Free PMC article.
-
Features of the EEG Pattern of Sleep Spindles and Its Diagnostic Significance in Ontogeny.Bull Exp Biol Med. 2022 Aug;173(4):399-408. doi: 10.1007/s10517-022-05557-5. Epub 2022 Sep 5. Bull Exp Biol Med. 2022. PMID: 36058972 Review.
References
-
- Borbély AA. A two process model of sleep regulation. Hum Neurobiol 1: 195–204, 1982 - PubMed
-
- Borbély AA, Baumann F, Brandeis D, Strauch I, Lehmann D. Sleep-deprivation: effect on sleep stages and EEG power density in man. Electroencephalogr Clin Neurophysiol 51: 483–493, 1981 - PubMed
-
- Buchmann A, Ringli M, Kurth S, Schaerer M, Geiger A, Jenni OG, Huber R. EEG sleep slow-wave activity as a mirror of cortical maturation. Cereb Cortex 21: 607–615, 2011 - PubMed
Publication types
MeSH terms
Grants and funding
LinkOut - more resources
Full Text Sources
Other Literature Sources
Medical