

FGF4 is required for lineage restriction and salt-and-pepper distribution of primitive endoderm factors but not their initial expression in the mouse
- PMID: 23193166
- PMCID: PMC3597205
- DOI: 10.1242/dev.084996
FGF4 is required for lineage restriction and salt-and-pepper distribution of primitive endoderm factors but not their initial expression in the mouse
Abstract
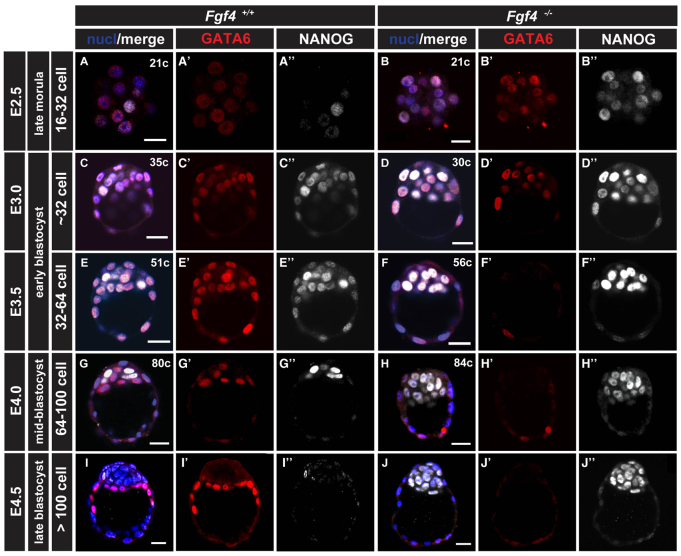
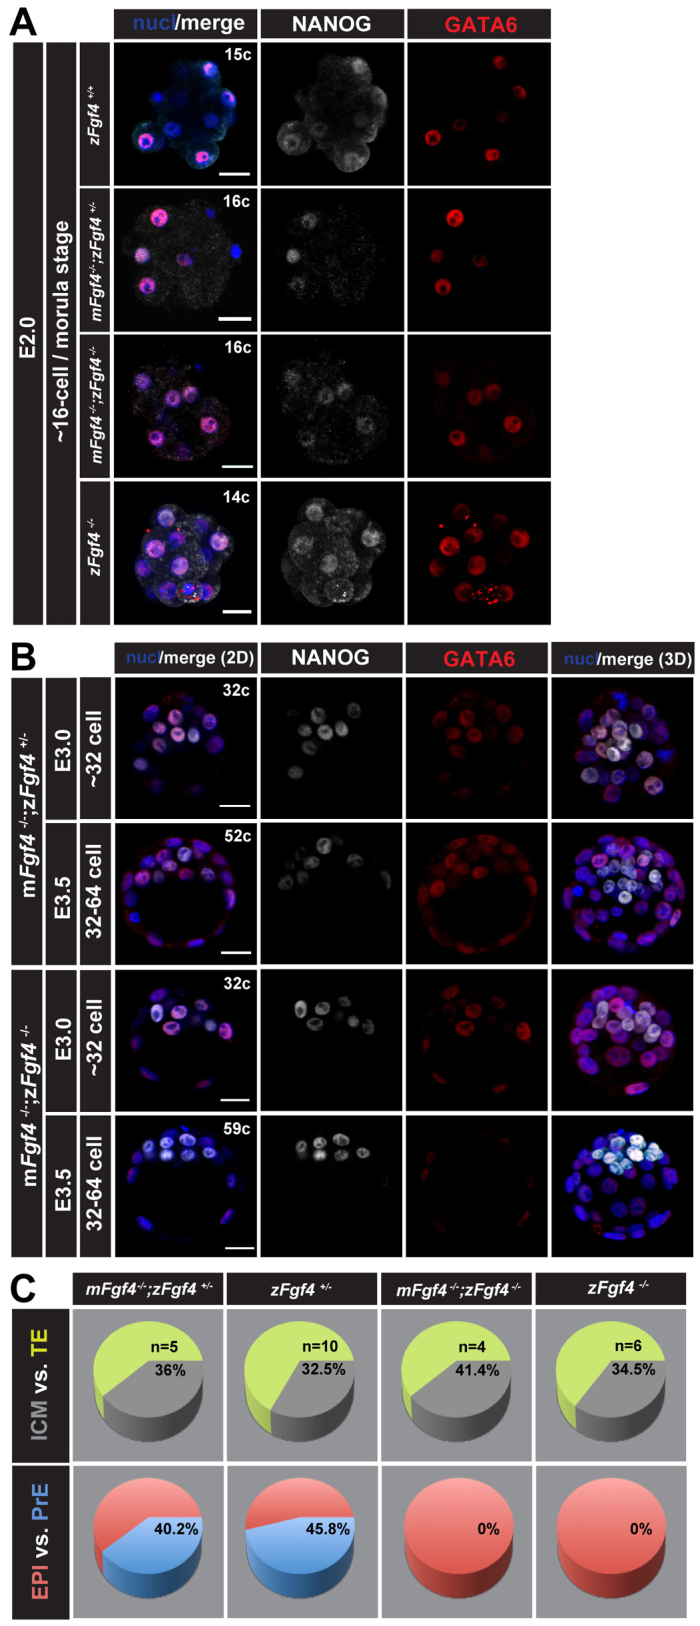
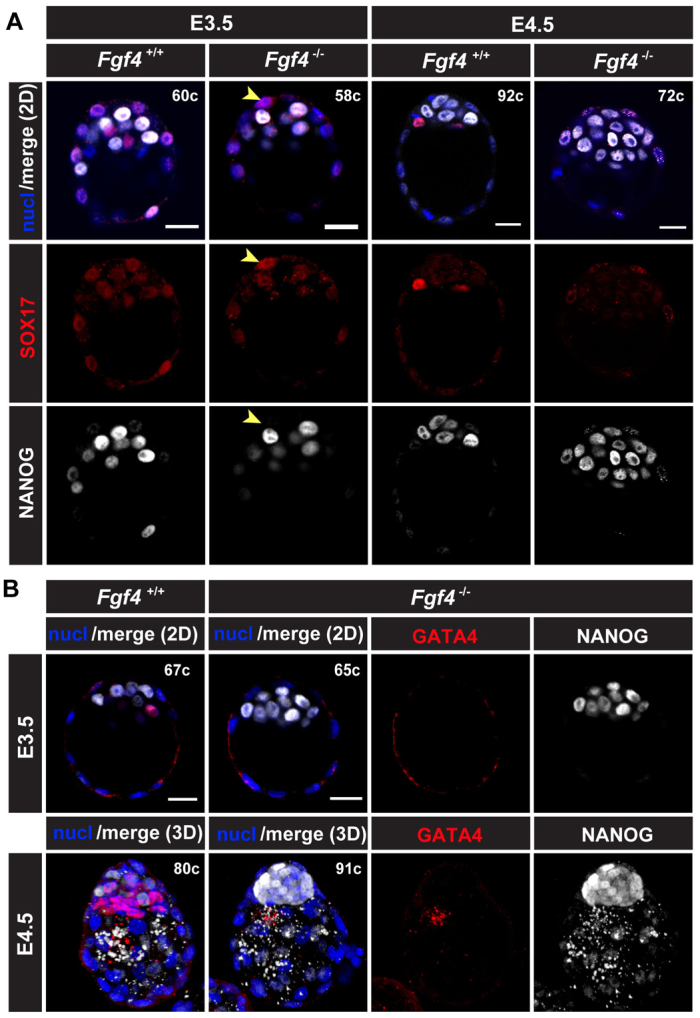
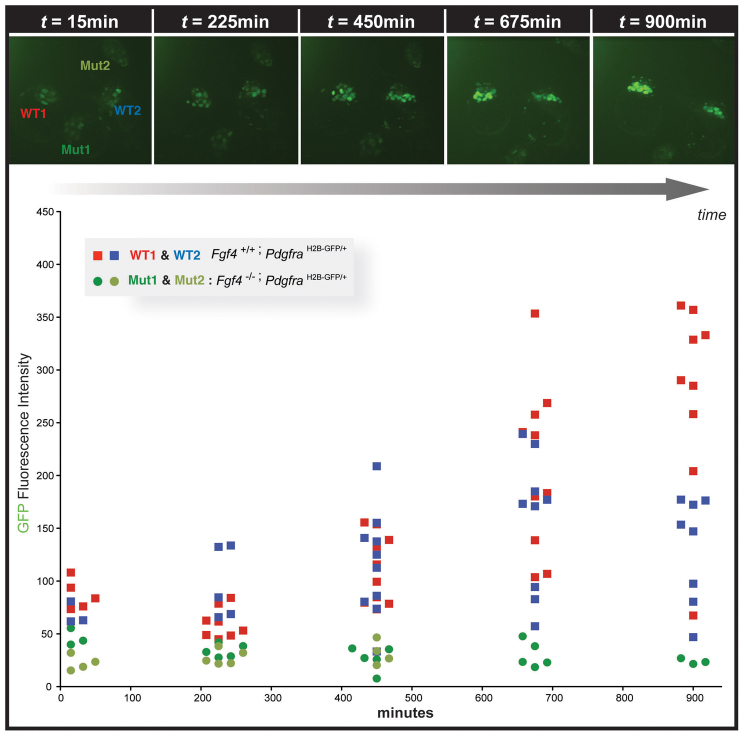
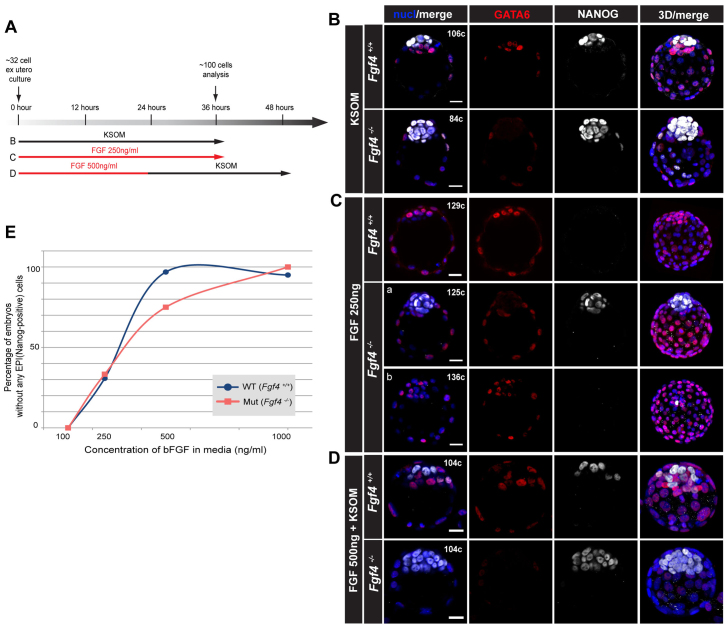
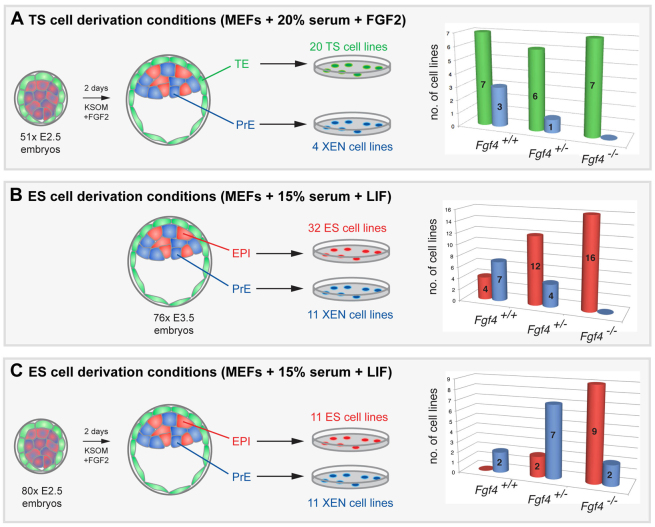
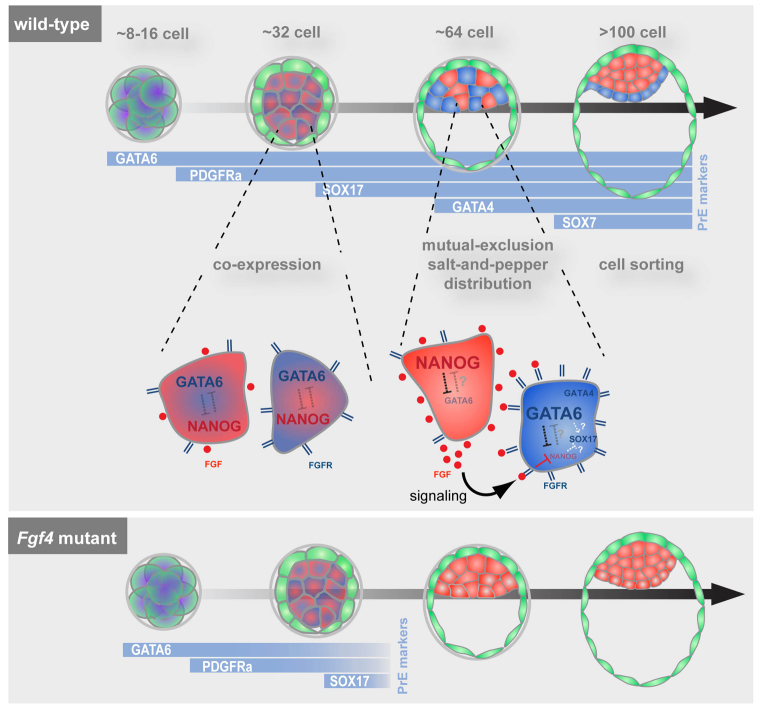
The emergence of pluripotent epiblast (EPI) and primitive endoderm (PrE) lineages within the inner cell mass (ICM) of the mouse blastocyst involves initial co-expression of lineage-associated markers followed by mutual exclusion and salt-and-pepper distribution of lineage-biased cells. Precisely how EPI and PrE cell fate commitment occurs is not entirely clear; however, previous studies in mice have implicated FGF/ERK signaling in this process. Here, we investigated the phenotype resulting from zygotic and maternal/zygotic inactivation of Fgf4. Fgf4 heterozygous blastocysts exhibited increased numbers of NANOG-positive EPI cells and reduced numbers of GATA6-positive PrE cells, suggesting that FGF signaling is tightly regulated to ensure specification of the appropriate numbers of cells for each lineage. Although the size of the ICM was unaffected in Fgf4 null mutant embryos, it entirely lacked a PrE layer and exclusively comprised NANOG-expressing cells at the time of implantation. An initial period of widespread EPI and PrE marker co-expression was however established even in the absence of FGF4. Thus, Fgf4 mutant embryos initiated the PrE program but exhibited defects in its restriction phase, when lineage bias is acquired. Consistent with this, XEN cells could be derived from Fgf4 mutant embryos in which PrE had been restored and these cells appeared indistinguishable from wild-type cells. Sustained exogenous FGF failed to rescue the mutant phenotype. Instead, depending on concentration, we noted no effect or conversion of all ICM cells to GATA6-positive PrE. We propose that heterogeneities in the availability of FGF produce the salt-and-pepper distribution of lineage-biased cells.
Figures
Similar articles
-
Gata6, Nanog and Erk signaling control cell fate in the inner cell mass through a tristable regulatory network.Development. 2014 Oct;141(19):3637-48. doi: 10.1242/dev.109678. Epub 2014 Sep 10. Development. 2014. PMID: 25209243
-
PI3K/AKT signaling controls ICM maturation and proper epiblast and primitive endoderm specification in mice.Dev Cell. 2025 Jan 20;60(2):204-219.e6. doi: 10.1016/j.devcel.2024.10.001. Epub 2024 Oct 25. Dev Cell. 2025. PMID: 39461340
-
Klf5 maintains the balance of primitive endoderm versus epiblast specification during mouse embryonic development by suppression of Fgf4.Development. 2017 Oct 15;144(20):3706-3718. doi: 10.1242/dev.150755. Epub 2017 Sep 4. Development. 2017. PMID: 28870993
-
Cell lineage allocation within the inner cell mass of the mouse blastocyst.Results Probl Cell Differ. 2012;55:185-202. doi: 10.1007/978-3-642-30406-4_10. Results Probl Cell Differ. 2012. PMID: 22918807 Free PMC article. Review.
-
[Epiblast and primitive endoderm cell specification during mouse preimplantation development: a combination between biology and mathematical modeling].Med Sci (Paris). 2016 Feb;32(2):192-7. doi: 10.1051/medsci/20163202013. Epub 2016 Mar 2. Med Sci (Paris). 2016. PMID: 26936177 Review. French.
Cited by
-
OCT4 is expressed in extraembryonic endoderm stem (XEN) cell progenitors during somatic cell reprogramming.bioRxiv [Preprint]. 2024 Jan 22:2024.01.22.576724. doi: 10.1101/2024.01.22.576724. bioRxiv. 2024. PMID: 38328220 Free PMC article. Preprint.
-
Stepwise pluripotency transitions in mouse stem cells.EMBO Rep. 2022 Sep 5;23(9):e55010. doi: 10.15252/embr.202255010. Epub 2022 Jul 29. EMBO Rep. 2022. PMID: 35903955 Free PMC article. Review.
-
Recognition and reconstruction of cell differentiation patterns with deep learning.PLoS Comput Biol. 2023 Oct 27;19(10):e1011582. doi: 10.1371/journal.pcbi.1011582. eCollection 2023 Oct. PLoS Comput Biol. 2023. PMID: 37889897 Free PMC article.
-
The birth of embryonic pluripotency.Philos Trans R Soc Lond B Biol Sci. 2014 Dec 5;369(1657):20130541. doi: 10.1098/rstb.2013.0541. Philos Trans R Soc Lond B Biol Sci. 2014. PMID: 25349450 Free PMC article. Review.
-
A close look at the mammalian blastocyst: epiblast and primitive endoderm formation.Cell Mol Life Sci. 2014 Sep;71(17):3327-38. doi: 10.1007/s00018-014-1630-3. Epub 2014 May 4. Cell Mol Life Sci. 2014. PMID: 24794628 Free PMC article. Review.
References
-
- Buehr M., Meek S., Blair K., Yang J., Ure J., Silva J., McLay R., Hall J., Ying Q. L., Smith A. (2008). Capture of authentic embryonic stem cells from rat blastocysts. Cell 135, 1287–1298 - PubMed
Publication types
MeSH terms
Substances
Grants and funding
LinkOut - more resources
Full Text Sources
Other Literature Sources
Molecular Biology Databases
Research Materials
Miscellaneous
