

Ohno's "peril of hemizygosity" revisited: gene loss, dosage compensation, and mutation
- PMID: 23193178
- PMCID: PMC3607304
- DOI: 10.1093/gbe/evs106
Ohno's "peril of hemizygosity" revisited: gene loss, dosage compensation, and mutation
Abstract
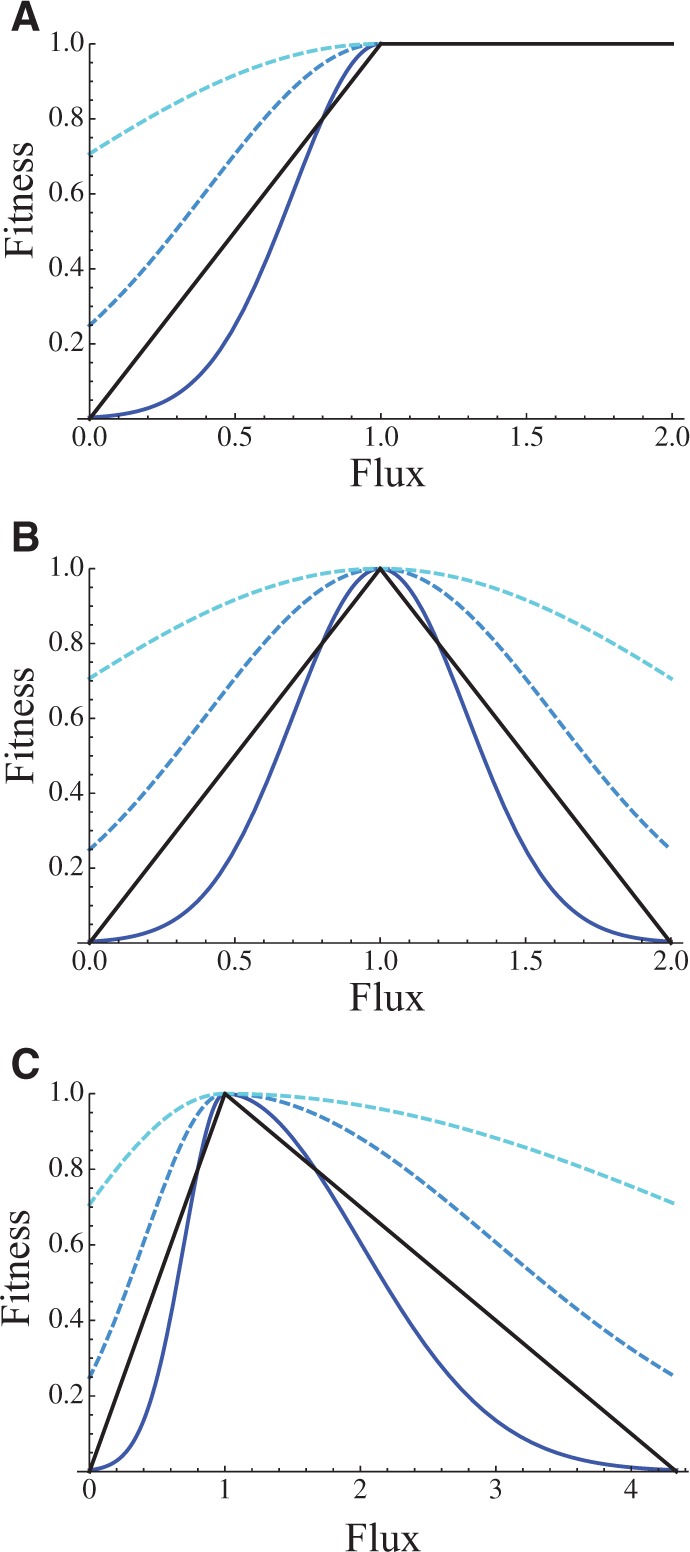
We explore the evolutionary origins of dosage compensation (DC) in sex chromosomes in the context of metabolic control theory. We consider first the cost of gene loss (hemizygosity) per se in reducing flux, and examine two relationships between flux and fitness (linear and Gaussian) to calculate a fitness cost of hemizygosity. Recognizing that new sex chromosomes are derived from autosomes, we also calculate the cost of unmasking deleterious mutations segregating on the nascent sex chromosomes as loci become hemizygous. The importance of deleterious mutations to the fitness cost of hemizygosity depends on their frequency, and on the relative costs of halving gene dose for wild-type alleles. We then consider the evolution of DC in response to gene loss, and include a cost of overexpression (i.e., DC such that expression exceeds the wild-type homozygote). Even with costs to excess flux, hypomorphic mutations can cause the optimal level of DC to be higher than 2-fold when the absolute cost of hemizygosity is small. Finally, we propose a three-step model of DC evolution: 1) once recombination ceases and the Y begins to deteriorate, genes from longer metabolic pathways should be lost first, as halving these genes does not drastically reduce flux or, thereby, fitness; 2) both the cost of hemizygosity and the presence of hypomorphic mutations will drive an increase in expression, that is, DC; 3) existing DC will now permit loss of genes in short pathways.
Figures


Similar articles
-
Hemizygosity Enhances Purifying Selection: Lack of Fast-Z Evolution in Two Satyrine Butterflies.Genome Biol Evol. 2016 Oct 23;8(10):3108-3119. doi: 10.1093/gbe/evw214. Genome Biol Evol. 2016. PMID: 27590089 Free PMC article.
-
Y recombination arrest and degeneration in the absence of sexual dimorphism.Science. 2022 Feb 11;375(6581):663-666. doi: 10.1126/science.abj1813. Epub 2022 Feb 10. Science. 2022. PMID: 35143289
-
Repeated Evolution of Transcript Dosage Compensation of Independently Formed Nematode Neo-X Chromosomes.Genome Biol Evol. 2025 Apr 3;17(4):evaf061. doi: 10.1093/gbe/evaf061. Genome Biol Evol. 2025. PMID: 40171700 Free PMC article.
-
Dosage compensation of the sex chromosomes.Annu Rev Genet. 2012;46:537-60. doi: 10.1146/annurev-genet-110711-155454. Epub 2012 Sep 4. Annu Rev Genet. 2012. PMID: 22974302 Free PMC article. Review.
-
A dynamic view of sex chromosome evolution.Curr Opin Genet Dev. 2006 Dec;16(6):578-85. doi: 10.1016/j.gde.2006.10.007. Epub 2006 Oct 19. Curr Opin Genet Dev. 2006. PMID: 17055249 Review.
Cited by
-
Genetic and epigenetic Muller's ratchet as a mechanism of frailty and morbidity during aging: a demographic genetic model.Hum Genet. 2020 Mar;139(3):409-420. doi: 10.1007/s00439-019-02067-9. Epub 2019 Nov 11. Hum Genet. 2020. PMID: 31713020
-
Spatial dynamics of evolving dosage compensation in a young sex chromosome system.Genome Biol Evol. 2015 Jan 23;7(2):581-90. doi: 10.1093/gbe/evv013. Genome Biol Evol. 2015. PMID: 25618140 Free PMC article.
-
The evolution of X chromosome inactivation in mammals: the demise of Ohno's hypothesis?Cell Mol Life Sci. 2014 Apr;71(8):1383-94. doi: 10.1007/s00018-013-1499-6. Epub 2013 Oct 31. Cell Mol Life Sci. 2014. PMID: 24173285 Free PMC article. Review.
References
-
- Bachtrog D, et al. Are all sex chromosomes created equal? Trends Genet. 2011;27:350–357. - PubMed
-
- Birchler JA. Claims and counterclaims of X-chromosome compensation. Nat Struct Mol Biol. 2012;19:3–5. - PubMed
-
- Bull JJ. Evolution of sex determining mechanisms. Menlo Park (CA): Benjamin Cummings; 1983.
Publication types
MeSH terms
Grants and funding
LinkOut - more resources
Full Text Sources
