. 2013 Feb;60(2):321-31.
doi: 10.1109/TBME.2012.2226242. Epub 2012 Oct 26.

Haustral fold segmentation with curvature-guided level set evolution

Affiliations

Haustral fold segmentation with curvature-guided level set evolution

Hongbin Zhu et al. IEEE Trans Biomed Eng. 2013 Feb.

Abstract

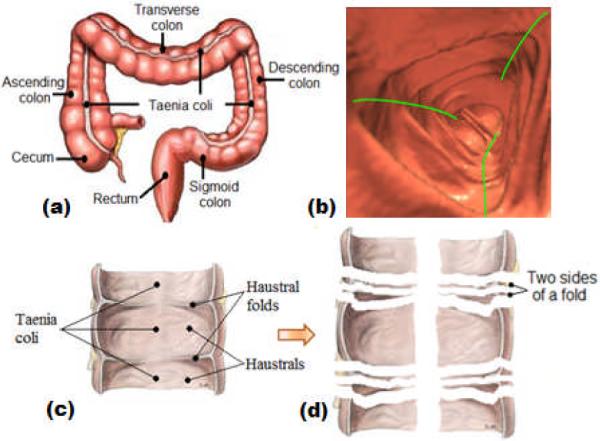
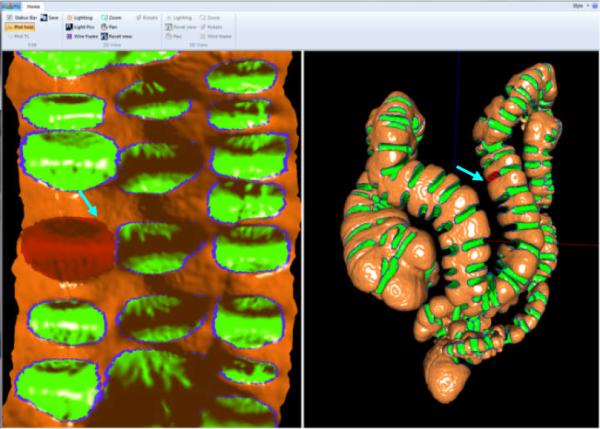
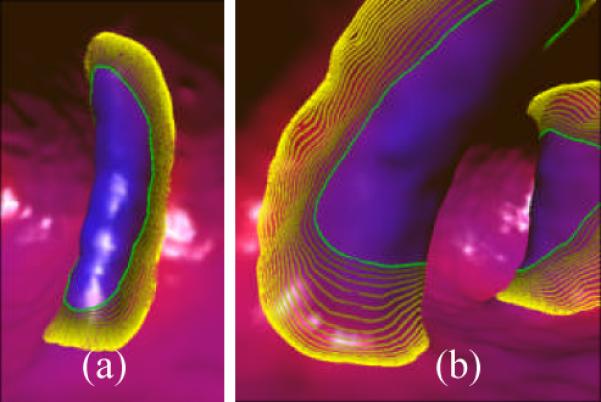
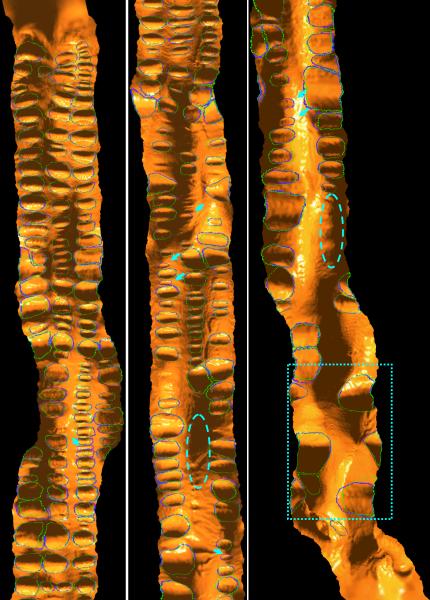
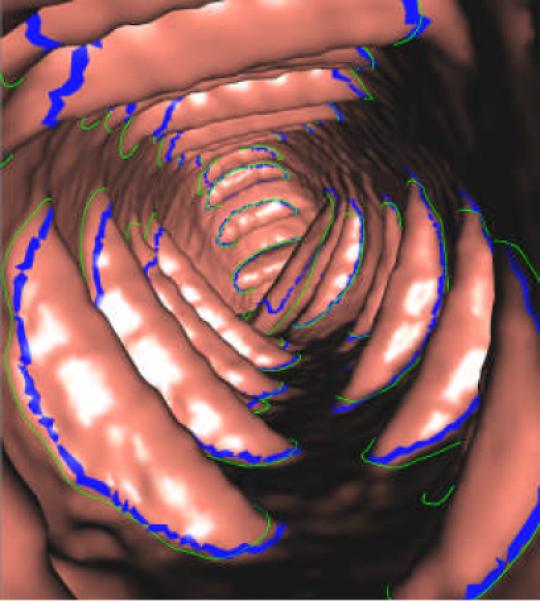
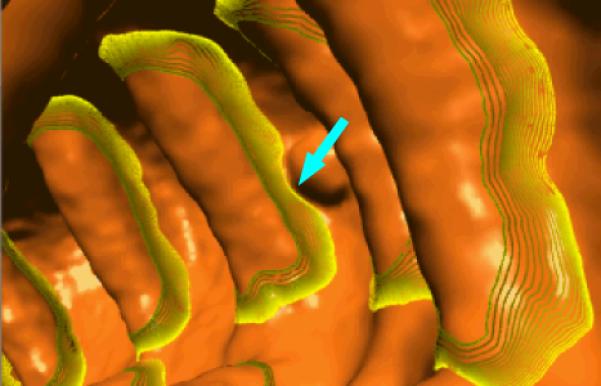
Human colon has complex structures mostly because of the haustral folds. The folds are thin flat protrusions on the colon wall, which complicate the shape analysis for computer-aided detection (CAD) of colonic polyps. Fold segmentation may help reduce the structural complexity, and the folds can serve as an anatomic reference for computed tomographic colonography (CTC). Therefore, in this study, based on a model of the haustral fold boundaries, we developed a level-set approach to automatically segment the fold surfaces. To evaluate the developed fold segmentation algorithm, we first established the ground truth of haustral fold boundaries by experts' drawing on 15 patient CTC datasets without severe under/over colon distention from two medical centers. The segmentation algorithm successfully detected 92.7% of the folds in the ground truth. In addition to the sensitivity measure, we further developed a merit of segmented-area ratio (SAR), i.e., the ratio between the area of the intersection and union of the expert-drawn folds and the area of the automatically segmented folds, to measure the segmentation accuracy. The segmentation algorithm reached an average value of SAR = 86.2%, showing a good match with the ground truth on the fold surfaces. We believe the automatically segmented fold surfaces have the potential to benefit many postprocedures in CTC, such as CAD, taenia coli extraction, supine-prone registration, etc.


Figures

Figure 1
Figure 1
(a) Viewing from outside, the colon is a long tubular structure, but it turns, twists and even mobiles in human abdomen. (b) Viewing from inside, there is a large number of folds extending into the colon lumen, andbetween the folds there are concave haustrals. Three taenia coli (TC, green curves) pass through the folds and haustrals in the longitudinal direction. (c) Three major sub-structures, folds, haustrals and TC. (d) Cutting along the TC, fold peaks and fold boundaries, the colon can be decomposed into pieces representing the haustrals, and the two sides of folds.
Figure 2
Figure 2
(a) A typical fold. The two blue curves indicate the concave bends where the fold meets its neighboring haustrals. The red curve denotes the convex bend at the top of the fold (fold peak). However, at the two fold ends around the two magenta circles, the fold smoothly merges into the haustral. (b) The blue curves are the detected ridge lines in [23]. Arrows indicate disconnections of the ridge lines at the fold boundaries. The green curve indicates the colon centerline.
Figure 3
Figure 3
Fold characteristics analysis. (a) A typical fold from descending colon. (b) A thick fold from sigmoid colon. (c) Curvature analysis on the fold in (a). (d) Curvature analysis on the fold in (b). With the software tool (to be detailed in Section III.A), we manually draw paths on the fold surfaces such as the thick curves in (a) and (b). Points are evenly sampled on the curves, and the smoothed shape index and mean curvature are calculated (to be detailed in Section II.C and II.D) and plotted in (c) and (d). For each point, the curvature measure is calculated by interpolation. The curve arrows indicate that the circle/rectangle areas are near to the locations on the 3D curves. Two red circles in (c) and (d) with no arrows represent the concaves on the other sides of the folds. Finally, the mean curvature and shape index are unitized into (0, 1] on the whole colon wall.
Figure 4
Figure 4
The whole flowchart of the fold segmentation algorithm.
Figure 5
Figure 5
(a) A triangle, the basic element in triangular surface domain. Point C is the barycenter, and c0, c1 are the middle points of the edges they are on. Then, the shadow area is part of the point area at p0 contributed by the triangle. (b) The 1-ring neighborhood, such as the green points pi with i=1, 2, …, of point p0 on a triangle mesh, which might be expanded by including more layers of points and refer to as 2-ring, 3-ring, …, neighborhood.
Figure 6
Figure 6
The smoothed mean curvature H¯ and shape index SI¯ of a patient scan. H¯ and SI¯ are both unitized into [0, 1], and linearly mapped into colors from blue to red. The mapped colors are displayed directly on the colon surface. (a) H¯ on the colon. (b) SI¯ on the colon. (c) Close view of H¯ on a fold (same fold as in Figure 3(a)). (d) Close view of SI¯ on the fold as in (c). (e) Close view of H¯ on a fold (same fold as in Figure 3(b)). (f) Close view of SI¯ on the fold as in (e). The fold in (c) and (d) is indicated by the solid arrow in (a) and (b), while the fold in (e) and (f) by the dashed arrow. The thick green curves in (d) and (f) indicate the initial fold detections (as detailed in II.E).
Figure 7
Figure 7
Endoluminal display of the detected iso-contours, i.e., the thick green curves. The arrow-pointed curves are redundant non-fold iso-contours. (a) Redundant iso-contours induced by TC. (b) Redundant iso-contour on a polyp. (c) The IFBs from (a) after filtration. (d) The IFBs from (b) after filtration.
Figure 8
Figure 8
LS function ϕ and ZLSS where ϕ = 0 in the domain Ω.
Figure 9
Figure 9
The software interface used to establish the ground truth. The left pane shows the 2D flattened colon surface where the shadow effect is visualized by the normal directions at the vertices in the original 3D colon surface. The right pane shows the 3D colon surface. In both panes, the fold boundaries from experts are in blue color, and the areas inside the boundaries are green color. The arrow-pointed red folds in left and right panes indicate a matched pair in 2D and 3D.
Figure 10
Figure 10
Examples of the evolution processes on two folds. The green thick curves show the IFBs, and the curves from gray yellow to bright yellow indicate the intermediate iso-contours every ten iteration steps, while the brightest yellow curves denote the final segmentation results. (a) The fold as in Figure 3(a). (b) The fold as in Figure 3(b).
Figure 11
Figure 11
The final segmentation result of one patient scan displayed in a 2D flattened view. From top to bottom, left to right, the images are from the cecum to rectum. The blue thick curves are the expert-drawn fold boundaries, while the green curves are the automatically extracted fold boundaries by the presented algorithm. Arrows indicate the missed folds. There is no false detection observed in the result, while the mismatch between the green and blue curves indicates the local under−/−over segmentation. The regions in the dashed ovals actually contain several folds, whose ground truths are difficult to figure out and so taken as non-significant folds as mentioned in section III.B. However, the dotted rectangle encloses some turns in the sigmoid colon and rectum, which are determined as true folds by both the experts and the segmentation algorithm although they might not be true ones.
Figure 12
Figure 12
3D endoluminal display of the final segmentation. The blue thick curves show the expert-drawn fold boundaries, while the green curves denote the computer-segmented fold boundaries.
Figure 13
Figure 13
The segmentation result a patient colon at the same location as that of Figure 7(b). The green and yellow curves are as depicted in Figure 10. The arrow indicates the segmented fold boundary around a polyp.

Similar articles

Cited by

References

    1. American Cancer Society . Cancer Facts & Figures 2008. American Cancer Society; Atlanta: 2008.
    1. Summers R, Yao J, Pickhardt P, Franaszek M, Bitter I, Brickman D, Krishna V, Choi R. Computed tomographic virtual colonoscopy computer-aided polyp detection in a screening population. Gastroenterology. 2005;129:1832–1844. - PMC - PubMed
    1. Zhu H, Liang Z, Pickhardt P, Barish M, You J, Fan Y, Lu H, Posniak E, Richards R, Cohen H. Increasing computer-aided detection specificity by projection features for CT colonography. Medical Physics. 2010;37(4):1468–1481. - PMC - PubMed
    1. Pickhardt P, Choi J, Hwang I, Butler J, Puckett M, Hildebrandt H, Wong R, Nugent P, Mysliwiec P, Schindler W. Computed tomographic virtual colonoscopy to screen for colorectal neoplasia in asymptomatic adults. New England Journal of Medicine. 2003;349(23):2191–2200. - PubMed
    1. Taylor S, Iinuma G, Saito Y, Zhang J, Halligan S. CT colonography: computer-aided detection of morphologically flat T1 colonic carcinoma. European Radiology. 2008;18(8):1666–1673. - PubMed

Publication types

MeSH terms