Polymorphism of human telomeric quadruplex structure controlled by DNA concentration: a Raman study
- PMID: 23193257
- PMCID: PMC3553954
- DOI: 10.1093/nar/gks1135
Polymorphism of human telomeric quadruplex structure controlled by DNA concentration: a Raman study
Abstract
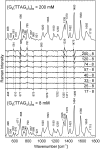
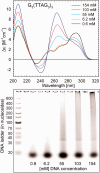
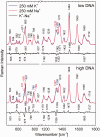
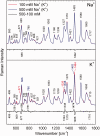
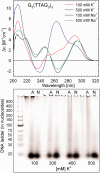
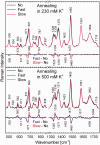
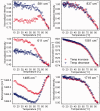
DNA concentration has been recently suggested to be the reason why different arrangements are revealed for K(+)-stabilized human telomere quadruplexes by experimental methods requiring DNA concentrations differing by orders of magnitude. As Raman spectroscopy can be applied to DNA samples ranging from those accessible by absorption and CD spectroscopies up to extremely concentrated solutions, gels and even crystals; it has been used here to clarify polymorphism of a core human telomeric sequence G(3)(TTAG(3))(3) in the presence of K(+) and Na(+) ions throughout wide range of DNA concentrations. We demonstrate that the K(+)-structure of G(3)(TTAG(3))(3) at low DNA concentration is close to the antiparallel fold of Na(+)-stabilized quadruplex. On the increase of G(3)(TTAG(3))(3) concentration, a gradual transition from antiparallel to intramolecular parallel arrangement was observed, but only for thermodynamically equilibrated K(+)-stabilized samples. The transition is synergically supported by increased K(+) concentration. However, even for extremely high G(3)(TTAG(3))(3) and K(+) concentrations, an intramolecular antiparallel quadruplex is spontaneously formed from desalted non-quadruplex single-strand after addition of K(+) ions. Thermal destabilization or long dwell time are necessary to induce interquadruplex transition. On the contrary, Na(+)-stabilized G(3)(TTAG(3))(3) retains its antiparallel folding regardless of the extremely high DNA and/or Na(+) concentrations, thermal destabilization or annealing.
Figures


Similar articles
-
Arrangements of human telomere DNA quadruplex in physiologically relevant K+ solutions.Nucleic Acids Res. 2009 Oct;37(19):6625-34. doi: 10.1093/nar/gkp701. Epub 2009 Aug 28. Nucleic Acids Res. 2009. PMID: 19717545 Free PMC article.
-
Human telomeric sequence forms a hybrid-type intramolecular G-quadruplex structure with mixed parallel/antiparallel strands in potassium solution.Nucleic Acids Res. 2006 May 19;34(9):2723-35. doi: 10.1093/nar/gkl348. Print 2006. Nucleic Acids Res. 2006. PMID: 16714449 Free PMC article.
-
Structure of the Hybrid-2 type intramolecular human telomeric G-quadruplex in K+ solution: insights into structure polymorphism of the human telomeric sequence.Nucleic Acids Res. 2007;35(15):4927-40. doi: 10.1093/nar/gkm522. Epub 2007 Jul 10. Nucleic Acids Res. 2007. PMID: 17626043 Free PMC article.
-
Intramolecular quadruplex conformation of human telomeric DNA assessed with 125I-radioprobing.Nucleic Acids Res. 2004 Oct 8;32(18):5359-67. doi: 10.1093/nar/gkh875. Print 2004. Nucleic Acids Res. 2004. PMID: 15475390 Free PMC article.
-
Structure of the human telomere in Na+ solution: an antiparallel (2+2) G-quadruplex scaffold reveals additional diversity.Nucleic Acids Res. 2013 Dec;41(22):10556-62. doi: 10.1093/nar/gkt771. Epub 2013 Sep 2. Nucleic Acids Res. 2013. PMID: 23999095 Free PMC article.
Cited by
-
Optimization of Gonyautoxin1/4-Binding G-Quadruplex Aptamers by Label-Free Surface-Enhanced Raman Spectroscopy.Toxins (Basel). 2022 Sep 6;14(9):622. doi: 10.3390/toxins14090622. Toxins (Basel). 2022. PMID: 36136560 Free PMC article.
-
Structure, Properties, and Biological Relevance of the DNA and RNA G-Quadruplexes: Overview 50 Years after Their Discovery.Biochemistry (Mosc). 2016 Dec;81(13):1602-1649. doi: 10.1134/S0006297916130034. Biochemistry (Mosc). 2016. PMID: 28260487 Free PMC article.
-
Stabilization of G-Quadruplex Structures of the SARS-CoV-2 Genome by TMPyP4, BRACO19, and PhenDC3.Int J Mol Sci. 2024 Feb 20;25(5):2482. doi: 10.3390/ijms25052482. Int J Mol Sci. 2024. PMID: 38473730 Free PMC article.
-
Negative volume changes of human G-quadruplexes at unfolding.Heliyon. 2020 Dec 13;6(12):e05702. doi: 10.1016/j.heliyon.2020.e05702. eCollection 2020 Dec. Heliyon. 2020. PMID: 33354631 Free PMC article.
-
In What Ways Do Synthetic Nucleotides and Natural Base Lesions Alter the Structural Stability of G-Quadruplex Nucleic Acids?J Nucleic Acids. 2017;2017:1641845. doi: 10.1155/2017/1641845. Epub 2017 Oct 18. J Nucleic Acids. 2017. PMID: 29181193 Free PMC article. Review.
References
-
- Blackburn EH. Switching and signaling at the telomere. Cell. 2001;106:661–673. - PubMed
-
- Harley CB, Futcher AB, Greider CW. Telomeres shorten during aging of human fibroblasts. Nature. 1990;345:458–460. - PubMed
-
- Kim NW, Piatyszek MA, Prowse KR, Harley CB, West MD, Ho PLC, Coviello GM, Wright WE, Weinrich SL, Shay JW. Specific association of human telomerase activity with immortal cells and cancer. Science. 1994;266:2011–2015. - PubMed
Publication types
MeSH terms
Substances
LinkOut - more resources
Full Text Sources
Research Materials

