Transposon integration enhances expression of stress response genes
- PMID: 23193295
- PMCID: PMC3553992
- DOI: 10.1093/nar/gks1185
Transposon integration enhances expression of stress response genes
Abstract
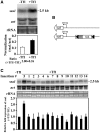
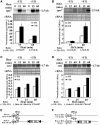
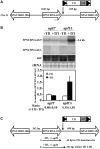
Transposable elements possess specific patterns of integration. The biological impact of these integration profiles is not well understood. Tf1, a long-terminal repeat retrotransposon in Schizosaccharomyces pombe, integrates into promoters with a preference for the promoters of stress response genes. To determine the biological significance of Tf1 integration, we took advantage of saturated maps of insertion activity and studied how integration at hot spots affected the expression of the adjacent genes. Our study revealed that Tf1 integration did not reduce gene expression. Importantly, the insertions activated the expression of 6 of 32 genes tested. We found that Tf1 increased gene expression by inserting enhancer activity. Interestingly, the enhancer activity of Tf1 could be limited by Abp1, a host surveillance factor that sequesters transposon sequences into structures containing histone deacetylases. We found the Tf1 promoter was activated by heat treatment and, remarkably, only genes that themselves were induced by heat could be activated by Tf1 integration, suggesting a synergy of Tf1 enhancer sequence with the stress response elements of target promoters. We propose that the integration preference of Tf1 for the promoters of stress response genes and the ability of Tf1 to enhance the expression of these genes co-evolved to promote the survival of cells under stress.
Figures


Similar articles
-
High-throughput sequencing of retrotransposon integration provides a saturated profile of target activity in Schizosaccharomyces pombe.Genome Res. 2010 Feb;20(2):239-48. doi: 10.1101/gr.099648.109. Epub 2009 Dec 29. Genome Res. 2010. PMID: 20040583 Free PMC article.
-
Retrotransposon Tf1 is targeted to Pol II promoters by transcription activators.Mol Cell. 2008 Apr 11;30(1):98-107. doi: 10.1016/j.molcel.2008.02.016. Mol Cell. 2008. PMID: 18406330 Free PMC article.
-
Determinants that specify the integration pattern of retrotransposon Tf1 in the fbp1 promoter of Schizosaccharomyces pombe.J Virol. 2011 Jan;85(1):519-29. doi: 10.1128/JVI.01719-10. Epub 2010 Oct 27. J Virol. 2011. PMID: 20980525 Free PMC article.
-
The Long Terminal Repeat Retrotransposons Tf1 and Tf2 of Schizosaccharomyces pombe.Microbiol Spectr. 2015 Aug;3(4):10.1128/microbiolspec.MDNA3-0040-2014. doi: 10.1128/microbiolspec.MDNA3-0040-2014. Microbiol Spectr. 2015. PMID: 26350316 Free PMC article. Review.
-
Nuclear roles and regulation of chromatin structure by the stress-dependent MAP kinase Sty1 of Schizosaccharomyces pombe.Mol Microbiol. 2011 Nov;82(3):542-54. doi: 10.1111/j.1365-2958.2011.07851.x. Epub 2011 Oct 13. Mol Microbiol. 2011. PMID: 21992435 Review.
Cited by
-
An Ancient Yeast for Young Geneticists: A Primer on the Schizosaccharomyces pombe Model System.Genetics. 2015 Oct;201(2):403-23. doi: 10.1534/genetics.115.181503. Genetics. 2015. PMID: 26447128 Free PMC article. Review.
-
Characterization of oncohistone H2B variants in Schizosaccharomyces pombe reveals a key role of H2B monoubiquitination deficiency in genomic instability by altering gene expression.FEMS Yeast Res. 2025 Jan 30;25:foaf027. doi: 10.1093/femsyr/foaf027. FEMS Yeast Res. 2025. PMID: 40402811 Free PMC article.
-
Formation of Extrachromosomal Circular DNA from Long Terminal Repeats of Retrotransposons in Saccharomyces cerevisiae.G3 (Bethesda). 2015 Dec 17;6(2):453-62. doi: 10.1534/g3.115.025858. G3 (Bethesda). 2015. PMID: 26681518 Free PMC article.
-
Somatizing the transposons action.Mob Genet Elements. 2017 Apr 13;7(3):1-9. doi: 10.1080/2159256X.2017.1314236. eCollection 2017. Mob Genet Elements. 2017. PMID: 28580196 Free PMC article. Review.
-
Regulation of DNA Replication through Natural Impediments in the Eukaryotic Genome.Genes (Basel). 2017 Mar 7;8(3):98. doi: 10.3390/genes8030098. Genes (Basel). 2017. PMID: 28272375 Free PMC article. Review.
References
-
- Moore SP, Liti G, Stefanisko KM, Nyswaner KM, Chang C, Louis EJ, Garfinkel DJ. Analysis of a Ty1-less variant of Saccharomyces paradoxus: the gain and loss of Ty1 elements. Yeast. 2004;21:649–660. - PubMed
-
- Bourc'his D, Bestor TH. Meiotic catastrophe and retrotransposon reactivation in male germ cells lacking Dnmt3L. Nature. 2004;431:96–99. - PubMed
Publication types
MeSH terms
Substances
Grants and funding
LinkOut - more resources
Full Text Sources
Miscellaneous

