. 2012 Oct;175(4):831-861.
doi: 10.1111/j.1467-985X.2011.01030.x.

Causality, mediation and time: a dynamic viewpoint

Affiliations
Free PMC article

Causality, mediation and time: a dynamic viewpoint

Odd O Aalen et al. J R Stat Soc Ser A Stat Soc. 2012 Oct.
Free PMC article

Abstract

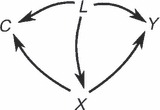
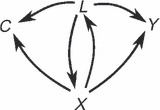
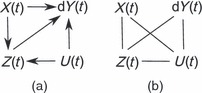
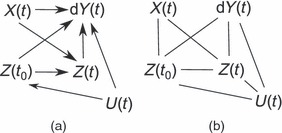
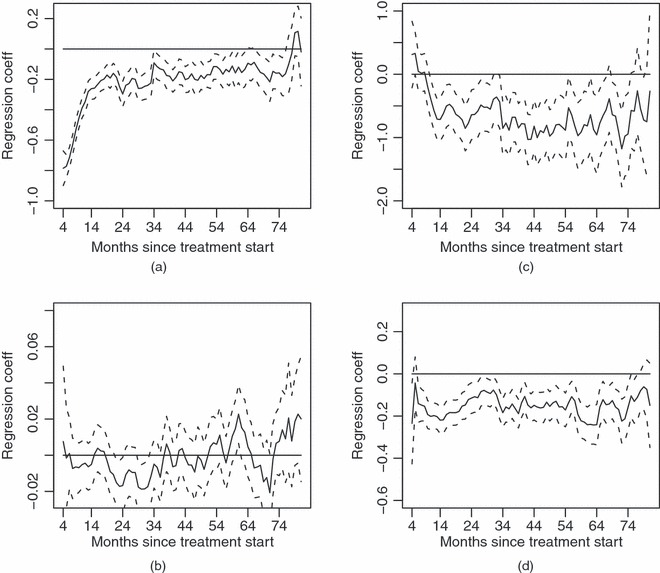
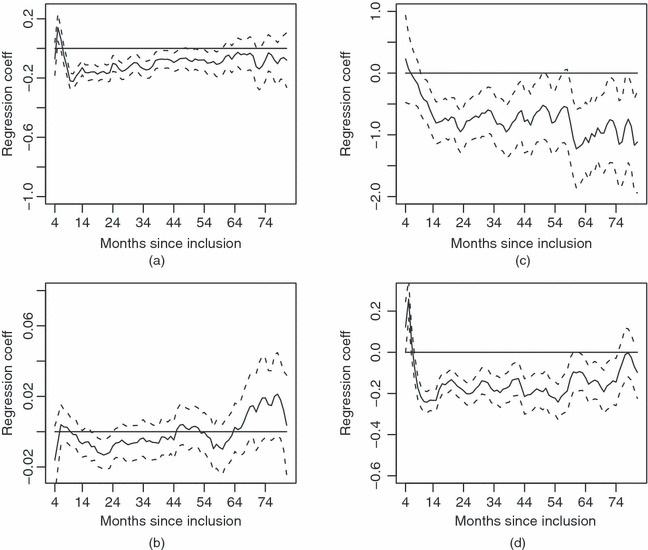
Time dynamics are often ignored in causal modelling. Clearly, causality must operate in time and we show how this corresponds to a mechanistic, or system, understanding of causality. The established counterfactual definitions of direct and indirect effects depend on an ability to manipulate the mediator which may not hold in practice, and we argue that a mechanistic view may be better. Graphical representations based on local independence graphs and dynamic path analysis are used to facilitate communication as well as providing an overview of the dynamic relations 'at a glance'. The relationship between causality as understood in a mechanistic and in an interventionist sense is discussed. An example using data from the Swiss HIV Cohort Study is presented.


Figures

Figure 1
Figure 1
Causal diagram illustrating the influence from an exposure X on an outcome Y, with the possible influence of a confounder C: intervening on X to give it a specific value breaks the influence of the confounder
Figure 2
Figure 2
(a) Relationship between components of a stochastic differential equation and (b) transformation made for calculating direct and indirect effects
Figure 3
Figure 3
Illustration of direct and indirect effects: node 1 has an indirect effect on nodes 3 and 4, with node 2 as a mediator; node 2 has both a direct and an indirect effect on node 4 with node 3 as a mediator
Figure 4
Figure 4
Local independence graph showing how the treatment process X influences the outcome process Y, the observed confounder process L, and the censoring process C: (a) independent censoring; (b) process L influences Y and C; all other processes are locally independent of the censoring process
Figure 5
Figure 5
Local independence graph showing how the treatment process X influences the outcome process Y and the censoring process C; the confounder process L influences X, Y and C
Figure 6
Figure 6
Local independence graph showing how the treatment process X influences the outcome process Y, the confounder process L and the censoring process C: the confounder process L influences X, Y and C
Figure 7
Figure 7
(a) Dynamic path diagram with exposure X(t), mediator Z(t), outcome dY(t) and unmeasured confounder U(t) and (b) moral graph corresponding to a lack of direct effect from the exposure X(t) to the outcome dY(t): it is seen that the mediator Z(t) does not block the path between X(t) and dY(t), but that there is also a path through the unmeasured confounder U(t)
Figure 8
Figure 8
(a) Dynamic path diagram with exposure X(t), covariate Z(t0), mediator Z(t), outcome dY(t) and unmeasured confounder U(t) and (b) moral graph corresponding to a lack of direct effect from the exposure X(t) to the outcome dY(t): it is seen that the covariates Z(t0) and Z(t) block the path between X(t) and dY(t)
Figure 9
Figure 9
Patients on HAART: two regression analyses are presented with (a), (b) increments of HIV-1 RNA and (c), (d) increments of CD4 cell values as dependent variables, and lagged values of HIV-1 RNA and CD4 cell values as independent values; the analysis is performed for each month
Figure 10
Figure 10
Patients not on HAART: two regression analyses are presented, with (a), (b) increments of HIV-1 RNA and (c), (d) increments of CD4 cell values as dependent variables, and lagged values of HIV-1 RNA and CD4 cell values as independent values; the analysis is performed for each month

References

    1. Aalen OO. Dynamic modelling and causality. Scand. Act. J. 1987:177–190.
    1. Aalen OO. Borgan Ø. Gjessing HK. New York: Springer; 2008. Survival and Event History Analysis: a Process Point of View.
    1. Aalen OO. Borgan Ø. Keiding N. Thormann J. Interaction between life history events: nonparametric analysis of prospective and retrospective data in the presence of censoring. Scand. J. Statist. 1980;7:161–171.
    1. Aalen OO. Frigessi A. What can statistics contribute to a causal understanding? Scand. J. Statist. 2007;34:155–168.
    1. Aalen OO. Gunnes N. A dynamic approach for reconstructing missing longitudinal data using the linear increments model. Biostatistics. 2010;11:453–472. - PMC - PubMed

Publication types

LinkOut - more resources