

A time series analysis of weather variability and all-cause mortality in the Kasena-Nankana Districts of Northern Ghana, 1995-2010
- PMID: 23195508
- PMCID: PMC3508691
- DOI: 10.3402/gha.v5i0.19073
A time series analysis of weather variability and all-cause mortality in the Kasena-Nankana Districts of Northern Ghana, 1995-2010
Abstract
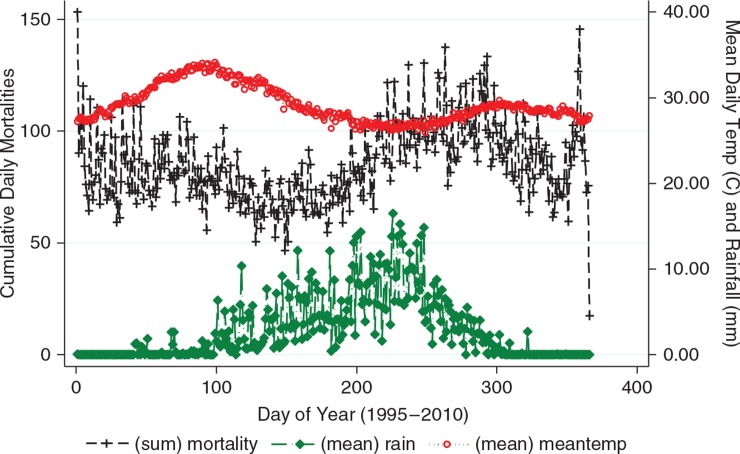
Introduction: Climate and weather variability can have significant health consequences of increased morbidity and mortality. However, today the impact of climate and weather variability, and consequentially, of climate change on population health in sub-Saharan Africa is not well understood. In this study, we assessed the association of daily temperature and precipitation with daily mortality by age and sex groups in Northern Ghana.
Methods: We analysed daily mortality and weather data from 1995 to 2010. We adopted a time-series Poisson regression approach to examine the short-term association of daily mean temperature and daily mean precipitation with daily mortality. We included time factors and daily lagged weather predictors and considered autocorrelation.
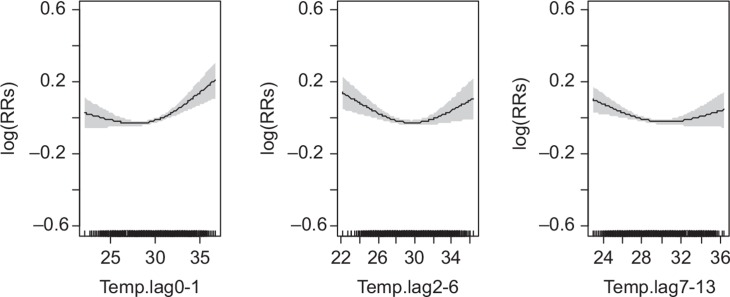
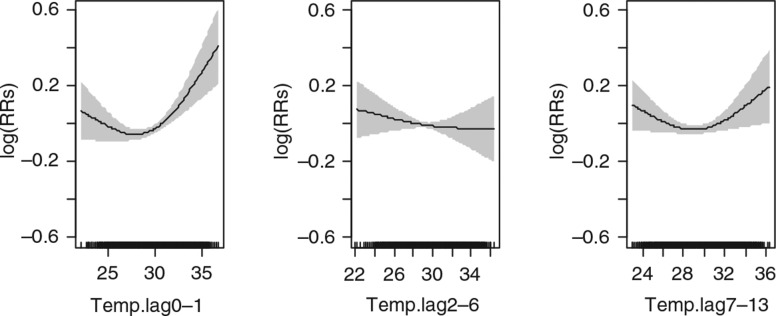
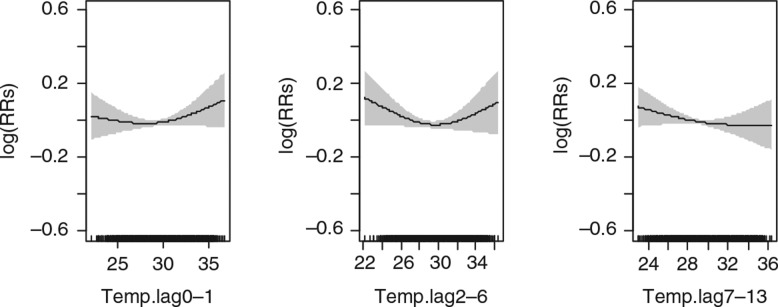
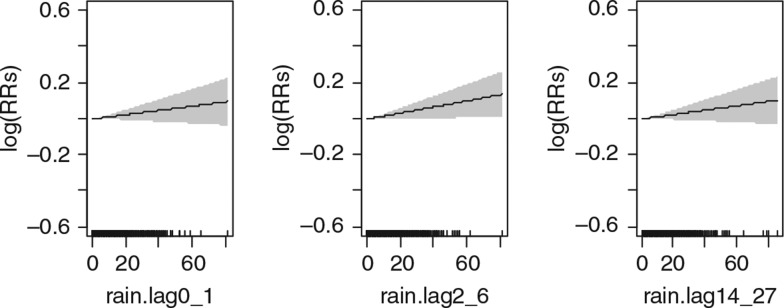
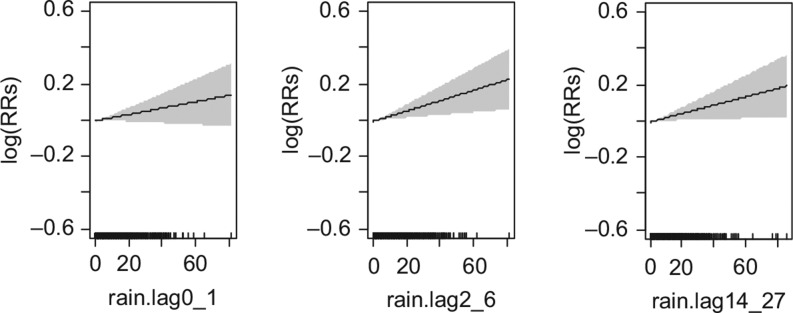
Results: For all populations, a statistically significant association of mean daily temperature with mortality at lag days 0-1 was observed below and above the 25th (27.48°C) and 75th (30.68°C) percentiles (0.19%; 95% confidence interval CI: 0.05%, 0.21%) and (1.14%; 95% CI: 0.12%, 1.54%), respectively. We also observed a statistically significant association of mean daily temperature above 75th percentile at lag days 2-6 and lag days 7-13 (0.32%; 95% CI: 0.16%, 0.25%) and 0.31% [95% CI: 0.14%, 0.26%]), respectively. A 10 mm increase in precipitation was associated with a 1.71% (95% CI: 0.10%, 3.34.9%) increase in mortality for all ages and sex groups at lag days 2-6. Similar results were also observed at lag days 2-6 and 14-27 for males, 2.92% (95% CI: 0.80%, 5.09%) and 2.35% (95% CI: 0.28%, 4.45%).
Conclusion: Short-term weather variability is strongly associated with mortality in Northern Ghana. The associations appear to differ among different age and sex groups. The elderly and young children were found to be more susceptible to short-term temperature-related mortality. The association of precipitation with mortality is more pronounced at the short-term for all age and sex groups and in the medium short-term among males. Reducing exposure to extreme temperature, particularly among the elderly and young children, should reduce the number of daily deaths attributable to weather-related mortality.
Figures
References
-
- Yu W, Mengersen K, Hu W, Guo Y, Pan X, Tong S. Assessing the relationship between global warming and mortality: lag effects of temperature fluctuations by age and mortality categories. Environ Pollut. 2011;159:1789–93. - PubMed
-
- Armstrong BG, Chalabi Z, Fenn B, Hajat S, Kovats S, Milojevic A, et al. Association of mortality with high temperatures in a temperate climate: England and Wales. J Epidemiol Community Health. 2011;65:340–5. - PubMed
-
- Astrom DO, Forsberg B, Rocklov J. Heat wave impact on morbidity and mortality in the elderly population: a review of recent studies. Maturitas. 2011;69:99–105. - PubMed
-
- Kalkstein LS. Health and climate change. Direct impacts in cities. Lancet. 1993;342:1397–9. - PubMed
-
- Kalkstein LS, Smoyer KE. The impact of climate change on human health: some international implications. Experientia. 1993;49:969–79. - PubMed
Publication types
MeSH terms
LinkOut - more resources
Full Text Sources