. 2013 Jan 25;288(4):2734-43.
doi: 10.1074/jbc.M112.425785. Epub 2012 Nov 29.

A specific and essential role for Na,K-ATPase α3 in neurons co-expressing α1 and α3

Affiliations

A specific and essential role for Na,K-ATPase α3 in neurons co-expressing α1 and α3

Guillaume Azarias et al. J Biol Chem. .

Abstract

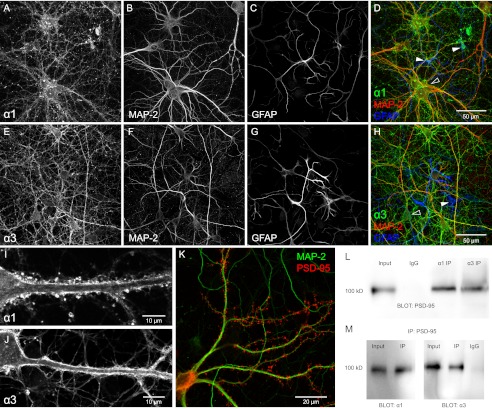
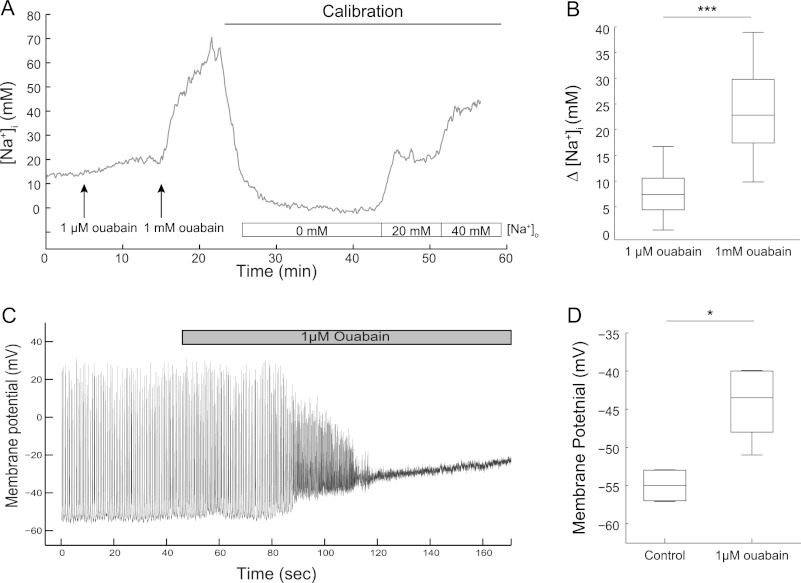
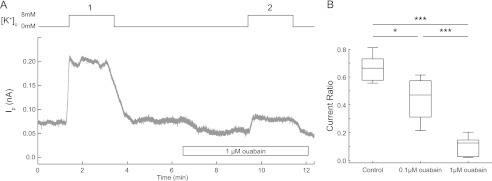
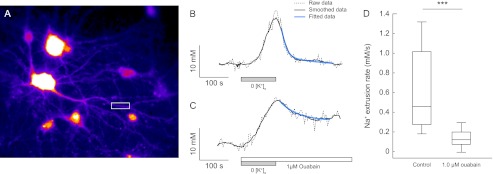
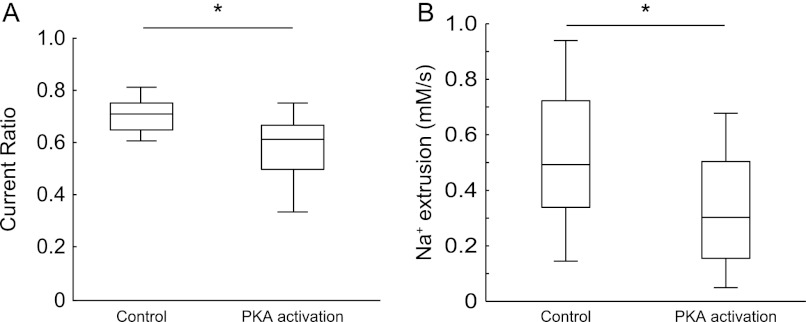
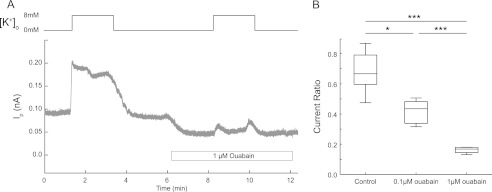
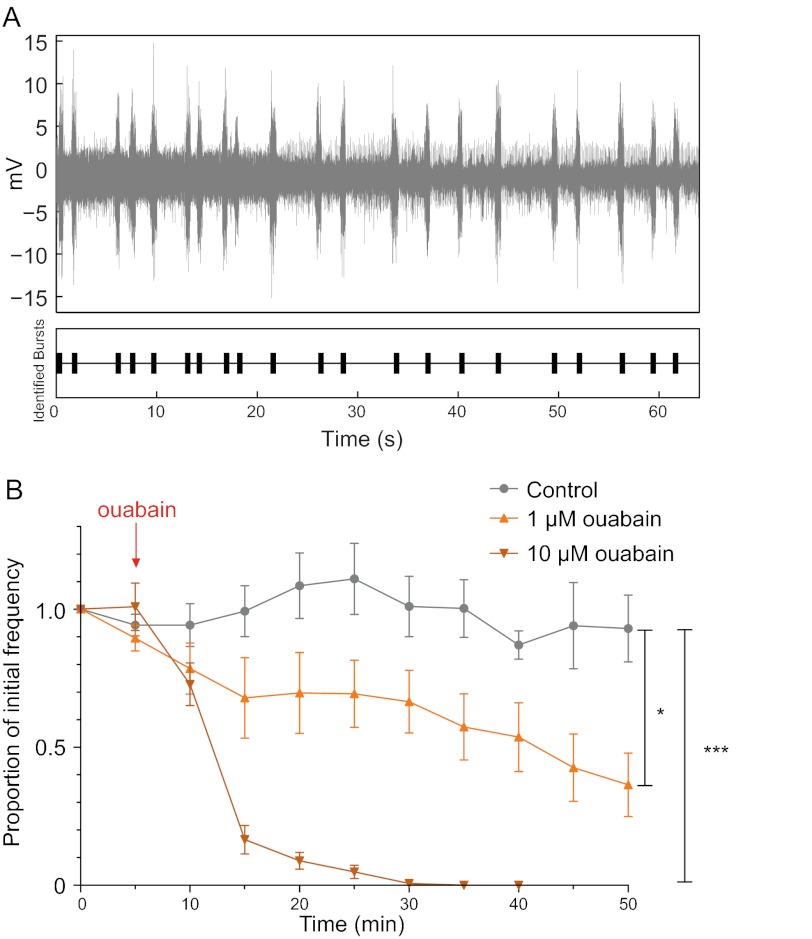
Most neurons co-express two catalytic isoforms of Na,K-ATPase, the ubiquitous α1, and the more selectively expressed α3. Although neurological syndromes are associated with α3 mutations, the specific role of this isoform is not completely understood. Here, we used electrophysiological and Na(+) imaging techniques to study the role of α3 in central nervous system neurons expressing both isoforms. Under basal conditions, selective inhibition of α3 using a low concentration of the cardiac glycoside, ouabain, resulted in a modest increase in intracellular Na(+) concentration ([Na(+)](i)) accompanied by membrane potential depolarization. When neurons were challenged with a large rapid increase in [Na(+)](i), similar to what could be expected following suprathreshold neuronal activity, selective inhibition of α3 almost completely abolished the capacity to restore [Na(+)](i) in soma and dendrite. Recordings of Na,K-ATPase specific current supported the notion that when [Na(+)](i) is elevated in the neuron, α3 is the predominant isoform responsible for rapid extrusion of Na(+). Low concentrations of ouabain were also found to disrupt cortical network oscillations, providing further support for the importance of α3 function in the central nervous system. The α isoforms express a well conserved protein kinase A consensus site, which is structurally associated with an Na(+) binding site. Following activation of protein kinase A, both the α3-dependent current and restoration of dendritic [Na(+)](i) were significantly attenuated, indicating that α3 is a target for phosphorylation and may participate in short term regulation of neuronal function.


Figures

FIGURE 1.
FIGURE 1.
Expression of Na,K-ATPase α1 and α3 isoforms at the plasma membrane of hippocampal neurons. A–D, primary culture of hippocampus stained with antibodies against α1, GFAP, and MAP-2. α1 immunoreactivity (A) is found in the majority of cells, including neuronal (MAP-2, B and D) and non-neuronal cells (GFAP, C and D). Filled and open arrowheads point out astrocytes and neurons, respectively. E–H, hippocampal culture stained with antibodies against α3 (E), GFAP (F), and MAP-2 (G). Only cells of neuronal morphology (MAP-2, F and H) display α3-specific signal (open arrowhead in H). I and J, confocal sections showing clear α immunoreactive signal in plasma membrane of soma and dendrites for α1 (I) and α3 (J). K, primary neurons transfected with PSD-95-mCherry to visualize dendritic spines (red) and stained with antibodies against MAP-2 (green) to visualize dendritic processes. L and M, co-immunoprecipitation of PSD-95 and Na,K-ATPase α1 and α3 from the rat hippocampus. Representative co-immunoprecipitation (IP) of PSD-95 and NKA α1, α3 protein complex using mouse α1, α3 mAb (L), and mouse monoclonal PSD-95 mAb (M). Mouse IgG (IgG) was used as a negative control. Input is whole lysate.
FIGURE 2.
FIGURE 2.
Inhibition of the Na,K-ATPase α3 increases [Na+]i in dendrites and depolarizes hippocampal neurons. A, example traces of [Na+]i recording in a neuron before and during successive perfusion of 1 μm and 1 mm ouabain. Calibration using ionophores are performed at the end of each experiment. B, box plot of increases in [Na+]i due to ouabain (data from 21 cells from five experiments). C, whole cell current clamp recording of a hippocampal neuron showing the depolarization resulting from treatment with 1 μm ouabain. D, membrane potential of hippocampal neurons before and after superfusion of 1 μm ouabain (n = 6 neurons from six experiments). *, p < 0.05; ***, p < 0.001, using paired t test.
FIGURE 3.
FIGURE 3.
Major contribution of the Na,K-ATPase α3 to total Na,K-ATPase Ip in hippocampal neurons. Hippocampal neurons were patch clamped and Na,K-ATPase-specific current was recorded under voltage-clamped configuration in hippocampal neurons. Na,K-ATPase was activated by superfusing a K+-containing buffer (8 mm). A, example trace of an Ip recording in the absence or the presence of ouabain in hippocampal neurons. B, box plot of Ip ratio (proportion of second K+-evoked Ip to first K+-evoked Ip) in the presence and absence of ouabain. The Ip was measured as the difference in current recorded at 0 and 8 mm extracellular K+. Control, n = 7 neurons; 0.1 μm ouabain, n = 4 neurons; 1.0 μm ouabain, n = 6 neurons. *, p < 0.05; ***, p < 0.001, using one-way ANOVA with Bonferroni correction.
FIGURE 4.
FIGURE 4.
The Na,K-ATPase α3 is responsible for Na+ clearance in hippocampal neurons. A, cells loaded with Asante Natrium Green-1, white boxes show typical dendritic recording region. B and C, typical traces of calibrated [Na+]i recordings measured in single dendrites of hippocampal neurons challenged by a transient superfusion with K+-free buffer. Na+ clearance was measured in the absence (B) or presence (C) of 1 μm ouabain. Biexponential fitting of smoothed data (black traces) are represented as blue traces. D, box plot of Na+ clearance rates in the absence (0.57 ± 0.11 mm/s) or presence of 1 μm ouabain (0.12 ± 0.02 mm/s). The horizontal line within the box is the median value. Control, n = 12 dendrites from six experiments; 1 μm ouabain, n = 19 dendrites from five experiments. ***, p < 0.001 using one-way ANOVA with Bonferroni correction.
FIGURE 5.
FIGURE 5.
Modulation of Na,K-ATPase α3 activity by activation of the PKA pathway. Hippocampal neurons were superfused with a solution containing cAMP analogs, inhibitors of cAMP degrading enzymes, and phosphatase inhibitors. A, box plot of the Ip ratio (proportion of second K+-evoked Ip to first K+-evoked Ip) during control and PKA-stimulating conditions. The Ip was measured as the average net current recorded during 8 mm extracellular K+. Control, n = 6 neurons; PKA activation, n = 9 neurons. B, box plot of Na+ clearance rate in the presence of vehicle (dimethyl sulfoxide, 0.11%) or drugs activating the PKA pathway. Dimethyl sulfoxide, n = 19 dendrites from four experiments; PKA, n = 15 dendrites from four experiments. *, p < 0.05, using one-way ANOVA with Bonferroni correction.
FIGURE 6.
FIGURE 6.
Functional role of Na,K-ATPase α3 in striatum. Na,K-ATPase-dependent current measured in striatal neurons. A, example trace of Ip recording in the absence or presence of ouabain. B, box plot of the Ip ratio (proportion of second K+-evoked Ip to first K+-evoked Ip). The Ip was measured as the difference in current recorded at 0 and 8 mm extracellular K+. Control, n = 11 neurons; 0.1 μm ouabain, n = 5 neurons; 1 μm ouabain, n = 5 neurons. *, p < 0.05; ***, p < 0.001, using one-way ANOVA with Bonferroni correction.
FIGURE 7.
FIGURE 7.
Inhibition of Na,K-ATPase α3 decreases spontaneous slow oscillations in cortex. A, recording of spontaneous neuronal network oscillation in somatosensory cortex. The bottom graph illustrates the analysis result of data using the Spike software (version 2). B, graph showing group data of extracellular multiunit recordings of spontaneous slow oscillations in rat cortical slices measured as a proportion of initial frequency. The frequency of network activity decreases significantly when 1 μm ouabain is applied to the bath. In the presence of 10 μm ouabain, oscillations are completely abolished. Control, n = 4; 1 μm ouabain, n = 6; 10 μm ouabain, n = 4 experiments. *, p < 0.05; ***, p < 0.001, using one-way ANOVA with Bonferroni correction.

References

    1. Dobretsov M., Stimers J. R. (2005) Neuronal function and α3 isoform of the Na/K-ATPase. Front. Biosci. 10, 2373–2396 - PubMed
    1. Blanco G., Mercer R. W. (1998) Isozymes of the Na-K-ATPase: heterogeneity in structure, diversity in function. Am. J. Physiol. 275, F633–650 - PubMed
    1. Kaplan J. H. (2002) Biochemistry of Na,K-ATPase. Annu. Rev. Biochem. 71, 511–535 - PubMed
    1. Hieber V., Siegel G. J., Fink D. J., Beaty M. W., Mata M. (1991) Differential distribution of (Na,K)-ATPase α isoforms in the central nervous system. Cell. Mol. Neurobiol. 11, 253–262 - PMC - PubMed
    1. McGrail K. M., Phillips J. M., Sweadner K. J. (1991) Immunofluorescent localization of three Na,K-ATPase isozymes in the rat central nervous system: both neurons and glia can express more than one Na,K-ATPase. J. Neurosci. 11, 381–391 - PMC - PubMed

Publication types

LinkOut - more resources